Moving a series from front to back on the plot, Filtering a series, Filter tool – Measurement Computing USB-5100 Series User Manual
Page 41: Moving a series from front to back on a plot
USB-5100 Series Software Help
Modifying a Plot
6. Click
Apply
to update the plot and keep the
Graph Label Properties
dialog box open. Click
Done
to
update the plot and close the dialog box.
Use the hand drag tool
to drag the label to another location if necessary. If the label is attached to a series,
you can drag the label to attach it to any other point on the graph. (The hand tool must be close enough to a
point to attach the label.) Labels that are attached to a point does move with that point during zooming and
panning. Free-floating labels do not move during zooming and panning.
To delete a label from the graph, select the label you want to remove and press <Delete>, or right-click the label
and choose
Remove
from the context menu.
Moving a Series from Front to Back on the Plot
You can shuffle the order of series by moving a series to the front or back on the plot. This is helpful if one
series is hidden behind another. It also changes the order of series in the Details pane, Points table, and the
legend.
To change the order of the series, complete the following steps:
1. Select the arrow tool .
2. Select the series you wish to move.
3. Right-click and select either Bring Series to Front or Send Series to Back.
Filtering a Series
You can filter data from existing series in the plot to create a new statistical series showing calculated data such
as average, minimum, and maximum values over a specified period of time. This filter applies to existing data
files only; there is an additional filter tool available when launching most loggers.
To filter a series in a plot, complete the following steps:
1. Select the series with the arrow tool , right-click on it and select
Filter Series
. from the context menu,
from the
Edit»Filter Series
.
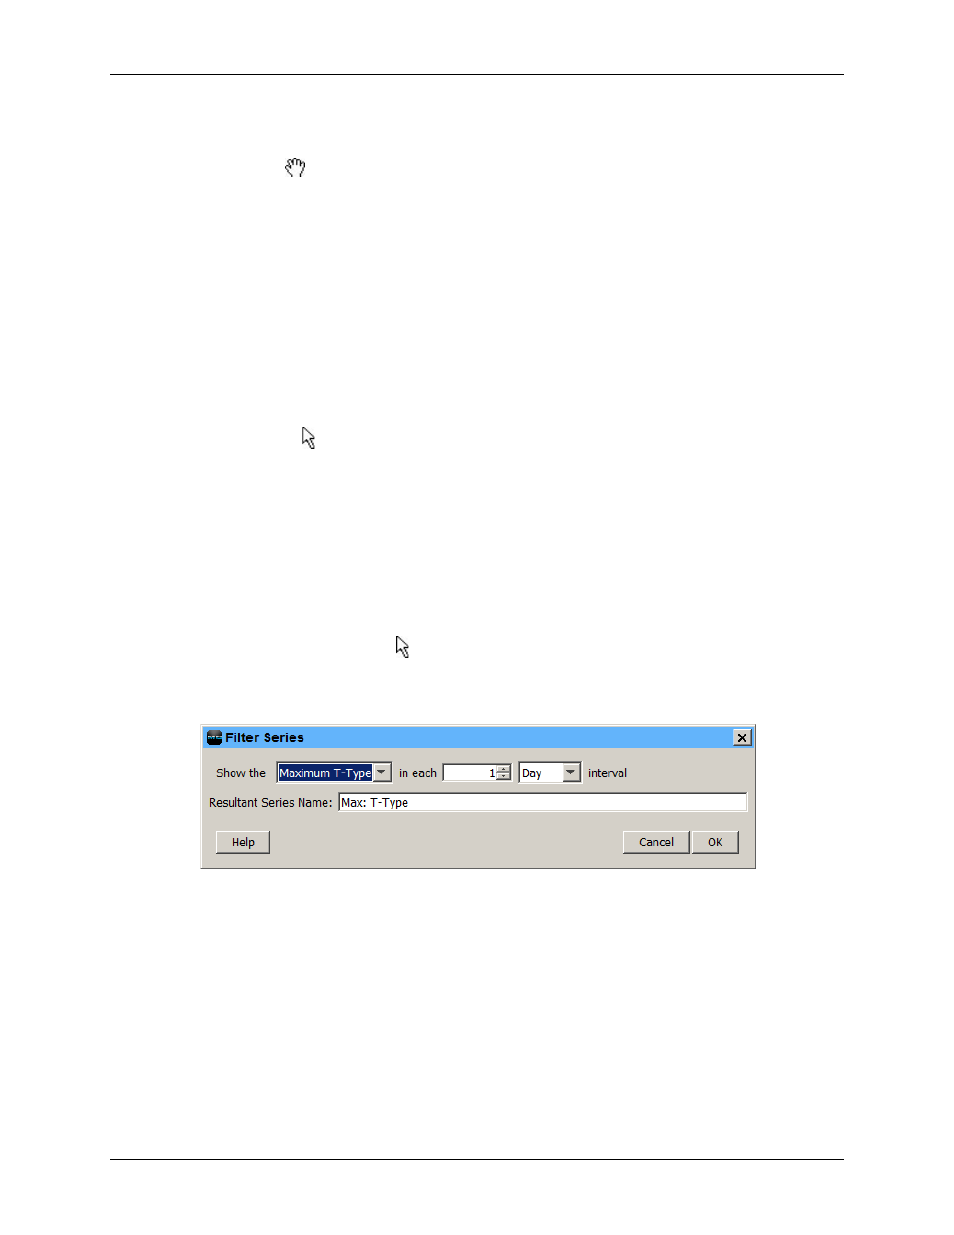
2. Select the statistic to use for the filter and the interval. The options available vary depending on the series
type. In the example below,
Maximum Temp
in each day is selected.
Figure 24. Filter Series Dialog Box
3. Enter a
Resultant Series Name
or use the default name entered based on the filter type.
4. Click
OK
. The new series is added to the graph, the Details pane, and the Points table. Note that when you
apply a filter, the graph rescales to accommodate all the displayed data.
41