Setting series properties – Measurement Computing USB-5100 Series User Manual
Page 37
USB-5100 Series Software Help
Modifying a Plot
Setting Series Properties
A series is the group of data points you selected to display in the plot. You can change the appearance of a
series on the plot including the line style, point marker, alarm values, associated axes, and color.
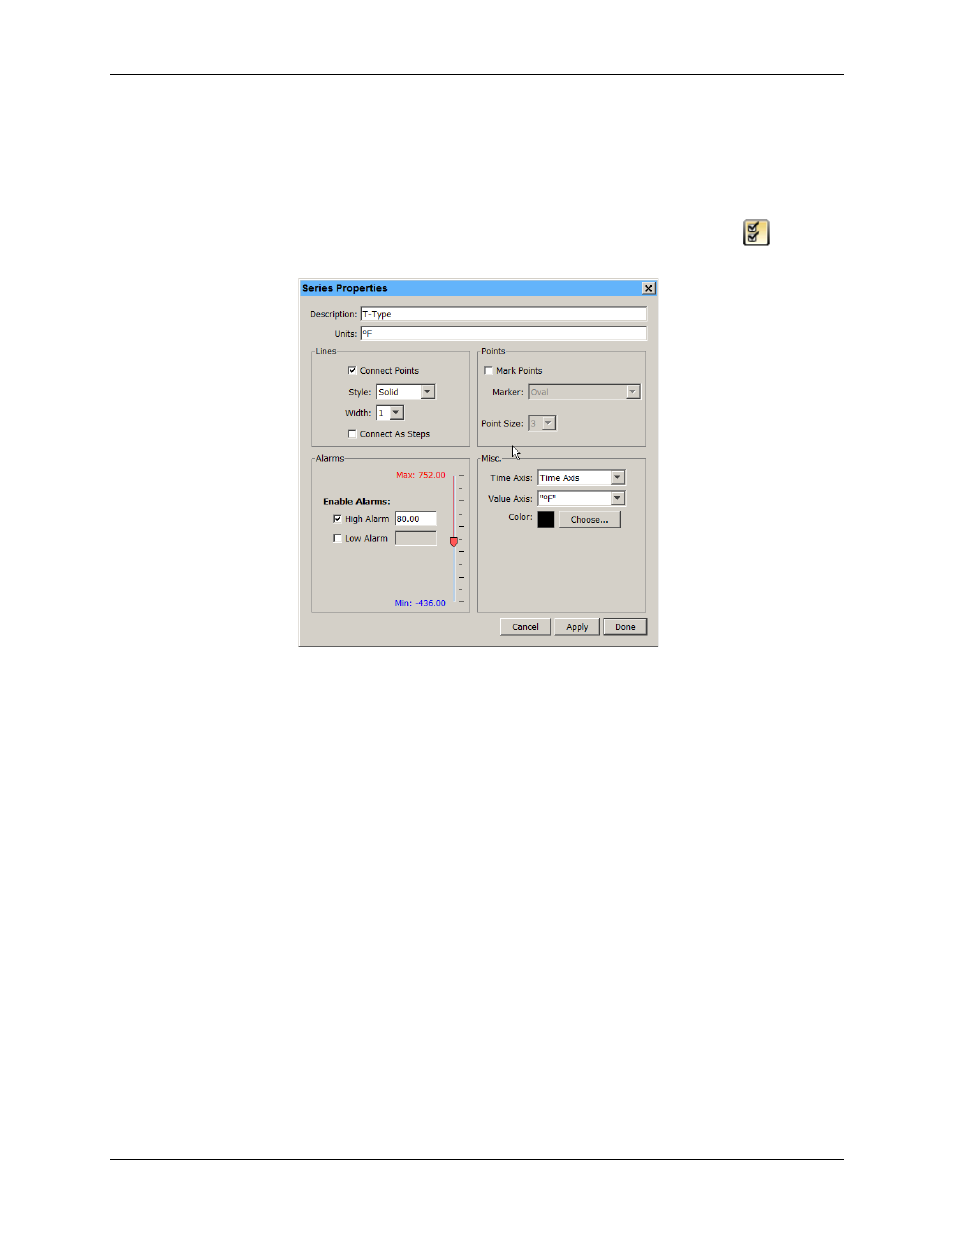
To change series properties, complete the following steps:
1. Double-click the series you wish to modify or select the series and click the Properties icon
to open
the
Series Properties
dialog box.
Figure 19. Series Properties Dialog Box
2. Change the default description. Type up to a 40-character name for the series. The series name is updated
in the legend, series pane, and details pane to the new name you entered.
3. Change the default units. Enter a different unit type as needed. The unit type is updated in the legend, series
pane, and details pane to the new unit type. Note that if you subsequently convert the units while viewing
the plot, your custom unit type is no longer be displayed. For example, if you change the unit type for a
temperature series from °F to a custom degrees unit. Then, while viewing the plot, you decide to convert
the data points to Celsius. The unit type for the temperature series automatically changes to °C instead of
the custom degrees unit that you had entered.
4. Adjust the appearance of the lines with the following options:
o
Connect Points:
This controls whether the plotted data points in the series are connected with a line.
o
Style
: This changes the appearance of the line used to connect the points in a series.
o
Width:
This changes the width of the line used to connect the points in a series.
o
Connect as Steps:
This controls whether the lines between the points in a series are connected as a
curve or a step. When this checkbox is selected, the line drawn between points keeps the value of the
previous point until the next point in the series. Connecting as steps is useful when plotting state or
event series.
5. Configure
High Alarm
and/
or Low Alarm
thresholds: Enabling alarms does show lines on the plot for the
series to indicate a visual threshold over or under which data may be falling (for example, if you want to
quickly see how many points fall below 32 degrees). Alarms are available for sensor measurement series
only, not for state or event series. Select the
High Alarm
checkbox and type a value relative to the series
where you want the maximum (red) alarm line to appear. Select the
Low Alarm
checkbox and type a value
relative to the series where you want the minimum (blue) alarm line to appear.
37