Statistics – Measurement Computing USB-5100 Series User Manual
Page 20
USB-5100 Series Software Help
Working with USB-5100 Series Data Loggers
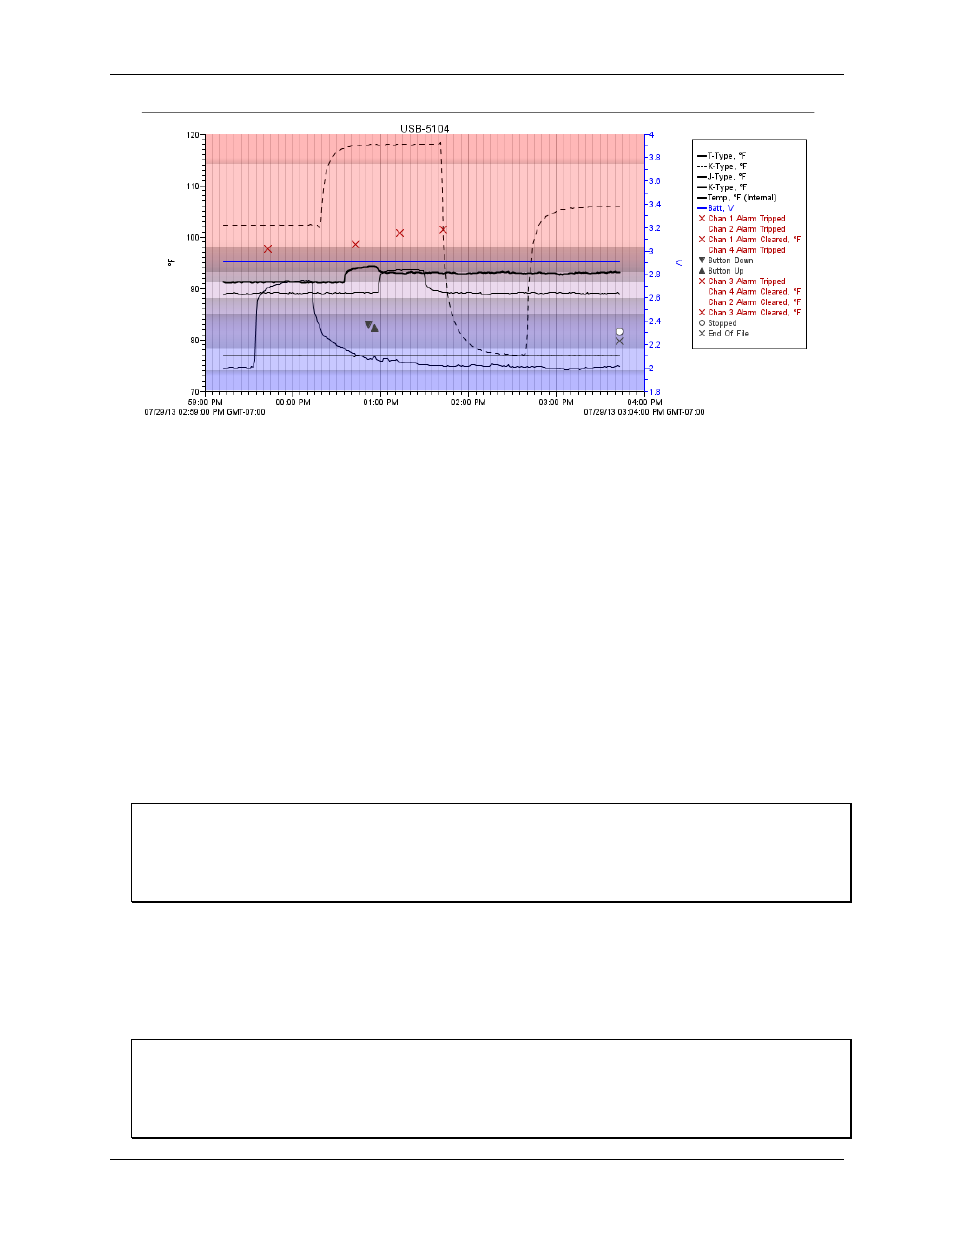
Figure 9. Alarms on a Plot
Statistics: Maximum, Minimum, Average, and Standard Deviation
You can configure USB-5100 Series loggers to calculate maximum, minimum, average, and standard deviation
statistics for all enabled sensors during logging at each logging interval based on samples taken at a rate you
specify. This results in up to four additional series per sensor that record the following information at each
logging interval:
The maximum, or highest, sampled value,
The minimum, or lowest, sampled value,
An average of all sampled values, and
The standard deviation from the average for all sampled values.
For example, with the logging interval set to five minutes, the sampling interval is set to 30 seconds, and
maximum, minimum, average, and standard deviation all enabled, once logging begins, the logger measures and
records the actual thermocouple values every five minutes. In addition, the logger takes a temperature sample
every 30 seconds and temporarily stores them in memory. The logger then calculates the maximum, minimum,
average, and standard deviation using the samples gathered over the previous five-minute period and logs the
resulting value(s). When reading out the logger, this results in five data series: one sensor series (with
temperature logged every five minutes) plus four maximum, minimum, average, and standard deviation series.
Notes
Statistics are not available for logging if Normal or Burst has been chosen as the Logging Mode in the Launch
Logger dialog box.
Statistics are only available on thermocouple channels and not on the internal temperature channel.
To configure statistics, complete the following steps
1. Select
Statistics
from the
Logging Mode
drop-down menu in the
Launch Logger
dialog box.
If Statistics has already been configured, click
Edit
.
2. Select the
Maximum
,
Minimum
,
Average
, and
Standard Deviation
checkboxes for each of the statistics
you want to calculate during logging. Note that Average is automatically selected when selecting Standard
Deviation.
Important
Statistics apply to all enabled sensors; every selected statistic is calculated for all sensors (except battery
voltage). For example, if thermocouples have been selected in the Launch Logger dialog box and you select
Average, then the average is calculated for temperature. The more statistics you record, the shorter the logger
duration and the more memory is required.
20