Actions, Menus – Measurement Computing USB-5100 Series User Manual
Page 31
USB-5100 Series Software Help
Reading Out, Plotting, and Analyzing Data
Use the Arrow tool to point to and select items on the graph to edit their properties (through a right-click
menu).
Use the Crosshair tool to zero in on a specific date and time in the plot and any data points associated with
that date and time. Click the Crosshair icon and then place your cursor anywhere on the plot to draw a red
vertical line at a particular point.
Use the Hand Drag tool to move different areas of the graph into view (panning) or to adjust the position of
one series so it can be viewed more easily. This is particularly useful when you are zoomed into the graph
and want to see another section of the graph without zooming out and then zooming back in on the new
location.
Use the Zoom tool to focus on one area of the graph, allowing you to see more detail.
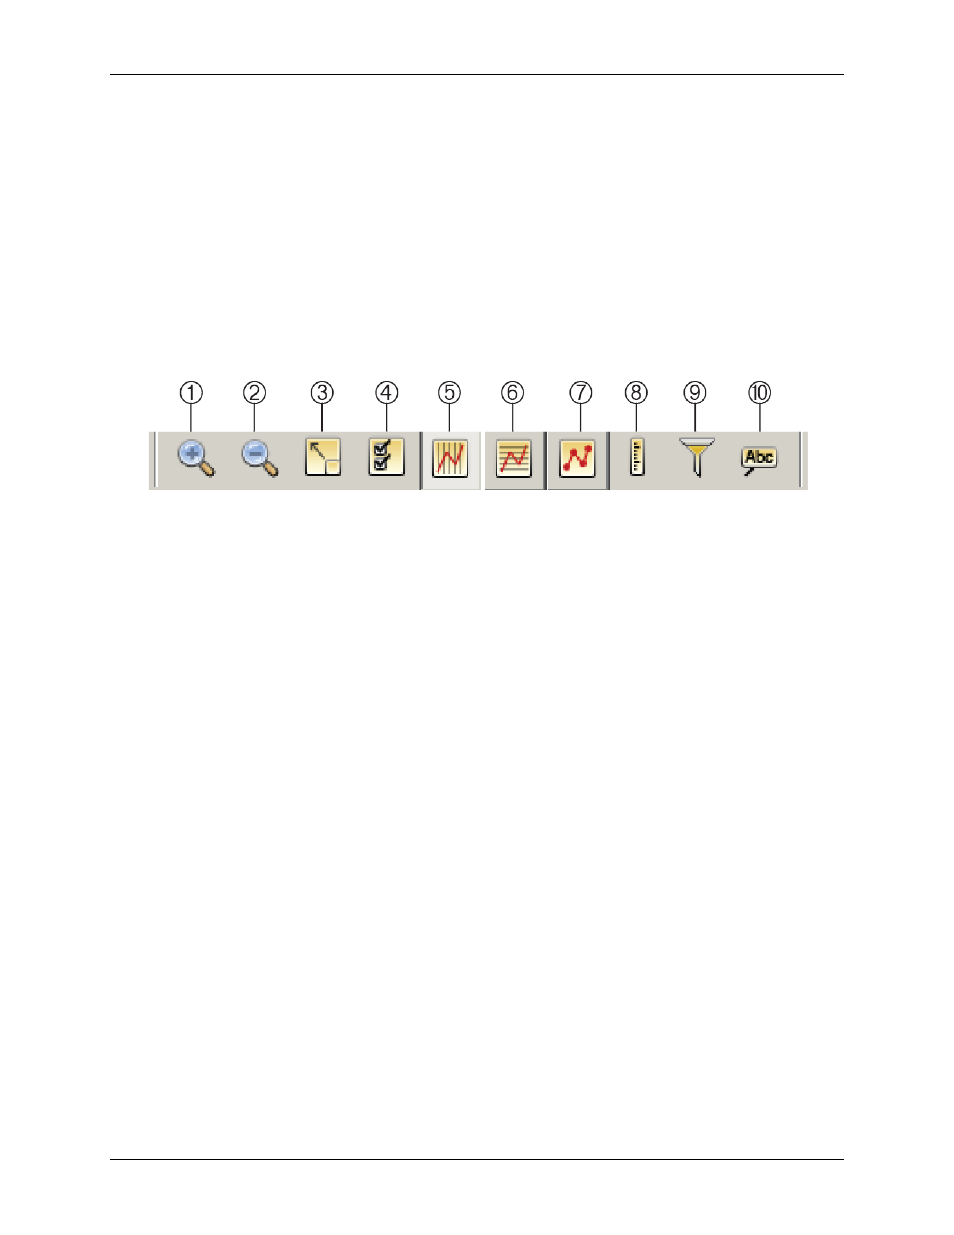
Actions
Use the Actions buttons on the toolbar to perform a number of actions on a plot or a series.
1
Zoom In button
6
Toggle all horizontal gridlines on/off button
2
Zoom Out button
7
Toggle point markers on/off button
3
Show Graph at Full Scale
8
Convert units for all series button
4
Graph Properties button
9
Filter Series button
5
Toggle all vertical gridlines on/off button
10
Add Graph Label button
Figure 17. Actions Buttons
Click the Zoom In/Zoom Out buttons to keep the plot centered as you zoom.
Click the Show Graph at Full Scale button to return to the original, full-scale version of the plot when the
data file was first opened.
Click the Graph Properties button to open the
View Properties
dialog box the plot element that is currently
selected, such as axis, series, legend, or title.
Click the Gridline buttons to toggle all horizontal or vertical gridlines on and off. You can also toggle
gridlines on and off for each axis individually. Using the arrow tool, double-click an axis to get the
dialog box. Select or clear the
Show Gridlines
checkbox to toggle the gridlines for that axis.
Click the Point Markers button to toggle the point markers for all series on and off. To show or hide
markers for an individual series, right-click the series to open the
Series Properties
dialog box. Select or
clear the
Mark Points
checkbox to toggle the markers for that series.
Click the Convert Units button to open the
dialog box, which allows you to convert the units
on certain series on the plot to other units (for example, from degrees Fahrenheit to degrees Celsius).
Click the Filter Series button to open the
Filter Series
dialog box and add a statistical series to the plot.
Click the Add Graph Label button to open the
Menus
Use the
Edit
and
View
menus to access various controls when working with a plot. You can also right-click an
element in the plot to access many of the same options available from the
Edit
and
View
menu and to open
properties dialog boxes.
31