A tour of the usb-5100 series software interface, The points table – Measurement Computing USB-5100 Series User Manual
Page 8
USB-5100 Series Software Help
Introducing USB-5100 Series
A Tour of the USB-5100 Series Software Interface
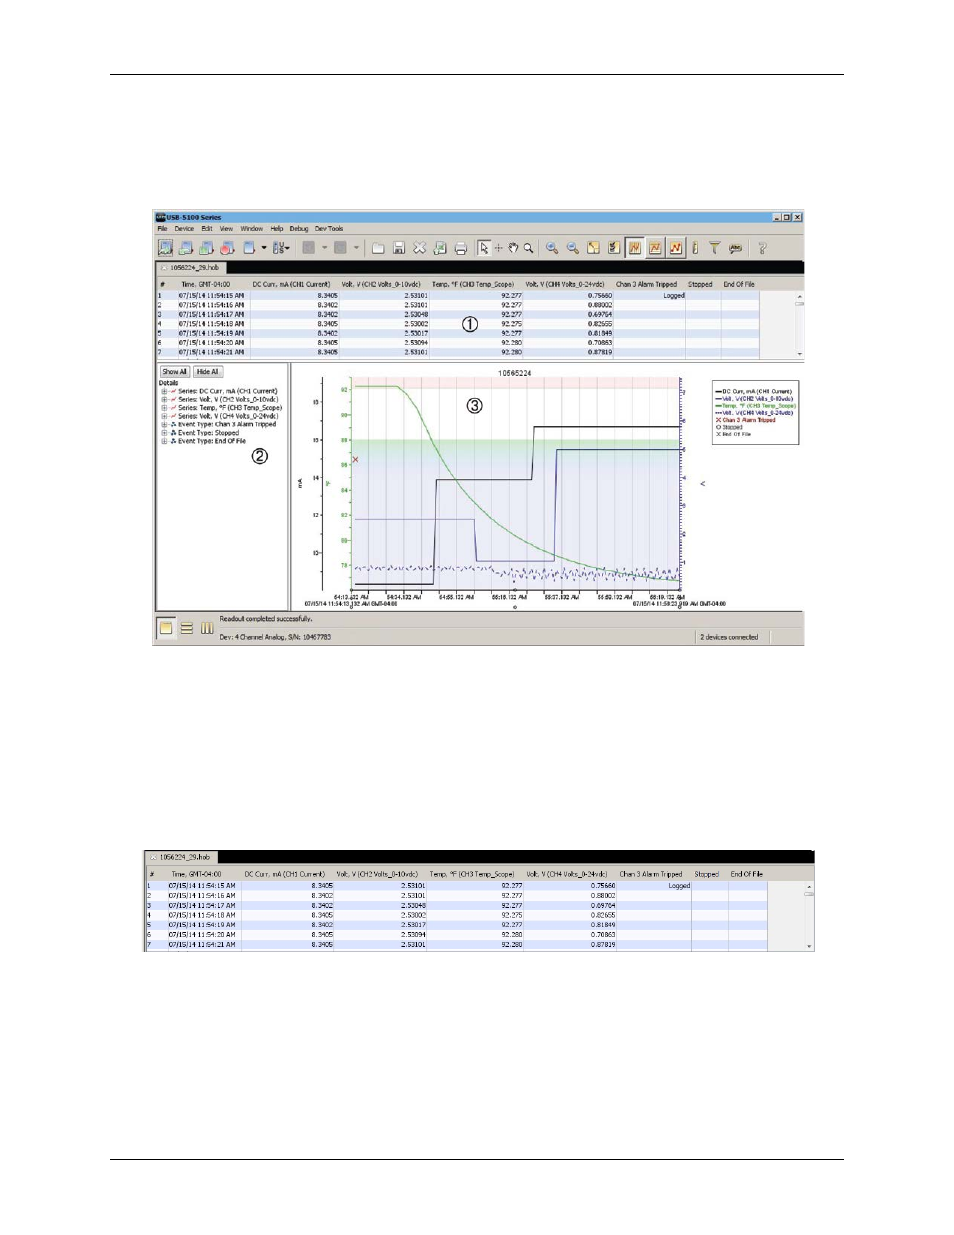
This is the main USB-5100 Series window. Use the menu bar or tool bar to access all the features within the
software. The status bar at the bottom of the window shows the current view in place (as selected from the
Window menu) as well as the device currently selected or connected.
1
Points table
3
Plot
2
Details pane
Figure 1. Main USB-5100 Series Window
This example shows a file that has been opened and plotted. There are three components to a plotted data file:
the Points Table, the Details Pane, and the Plot.
The Points Table
The Points Table lists data points (values) and logged events displayed in the plot. The Points Table is linked to
the graph – only the data for the series and events on the plot are listed in the Points Table.
Figure 2. Points Table
The data points are listed chronologically. Each point or event is listed in a single row and each series or event
type is displayed in a column. You can resize the columns by clicking and dragging the dividers between the
column headers.
8