Setting axis properties – Measurement Computing USB-5100 Series User Manual
Page 36
USB-5100 Series Software Help
Modifying a Plot
Setting Axis Properties
You can change the appearance of the time axis (x axis) and the value axis (y axis) on the plot. You can
customize the axis name, change the location, bounds, tick marks, color, and more.
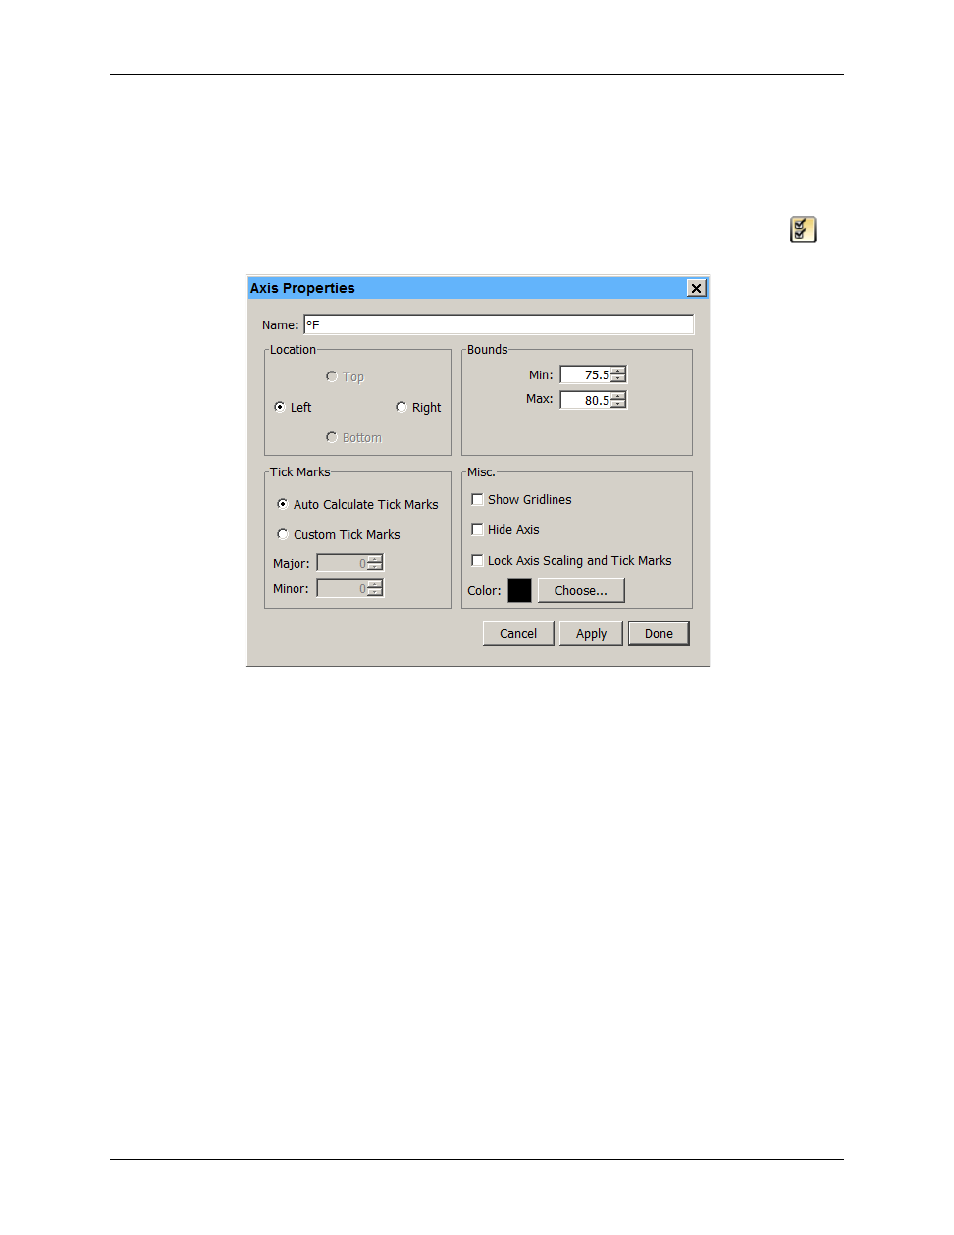
To change the axis properties, complete the following steps:
1. Double-click the axis in the plot with the arrow tool, or select the axis and click the Properties icon
to
open the
Axis Properties
dialog box.
Figure 18. Axis Properties Dialog Box
2. In the
Name
field, enter up to a 40-character name for the axis. The default name for a value axis is the unit
type (for example, °
F
is the name for a temperature axis and
%
is the name for an RH axis). The time axis
does not have a default name. To add
Time
as the default name for this axis, select
File»Preferences»Plotting»Other Options
and select the
Label the time axis
checkbox.
3. Change the location of the axis. The value axis can be located on the left or right while the time axis can be
located at the top or bottom
4. By default, tick marks are auto-calculated. Numbers or values are listed next to major tick marks and minor
tick marks are not numbered. To change the default tick marks, select
Custom Tick Marks
and then choose
the values for Major and Minor tick marks as desired.
5. Change the default bounds used on each axis. For the time axis, select the dates and times you want the axis
to display. For the value axis, type the minimum and maximum value you want the axis to display.
6. You can also modify the appearance of the axis with these options:
o
Show Gridlines:
This toggles whether gridlines are displayed in the background. Gridlines are shown
by default for the time axis, but not for the value axis.
o
Hide Axis:
This controls whether the axis is displayed or temporarily hidden.
o
Lock Axis Scaling and Tick Marks:
This controls whether the axis and associated tick marks remain
in their original position when zooming or navigating with the hand tool. Locking the axis and tick
marks helps to avoid inadvertently zooming or navigating to an area on the graph without data.
o
Color:
Black is the default color for the time axis. The color of the value axis matches the series color
by default. You can change the color for either axis as desired.
7. Click
Apply
to update the plot and keep the Axis Properties dialog box open. Click Done to update the plot
and close the dialog box.
36