Setting legend properties, Setting title properties – Measurement Computing USB-5100 Series User Manual
Page 38
USB-5100 Series Software Help
Modifying a Plot
6. Select the
Mark Points
checkbox to add a marker for each data point in the series. To avoid cluttering the
plot, this option is only enabled by default for series with event data or that have only one data point. If you
enable Mark Points, you can change the shape of the marker and the point size.
7. You can also modify the following:
o
Time Axis:
This allows you to create an additional time axis for this series. This is useful for
comparing data from two different time periods.
o
Value Axis:
This changes the axis being used for the series. Choose one of the axes already in view or
select New Value Axis from the dropdown list to create your own.
o
Color:
This changes the color used for the series.
8. Click
Apply
to update the plot and keep the Series Properties dialog box open. Click Done to update the
plot and close the dialog box.
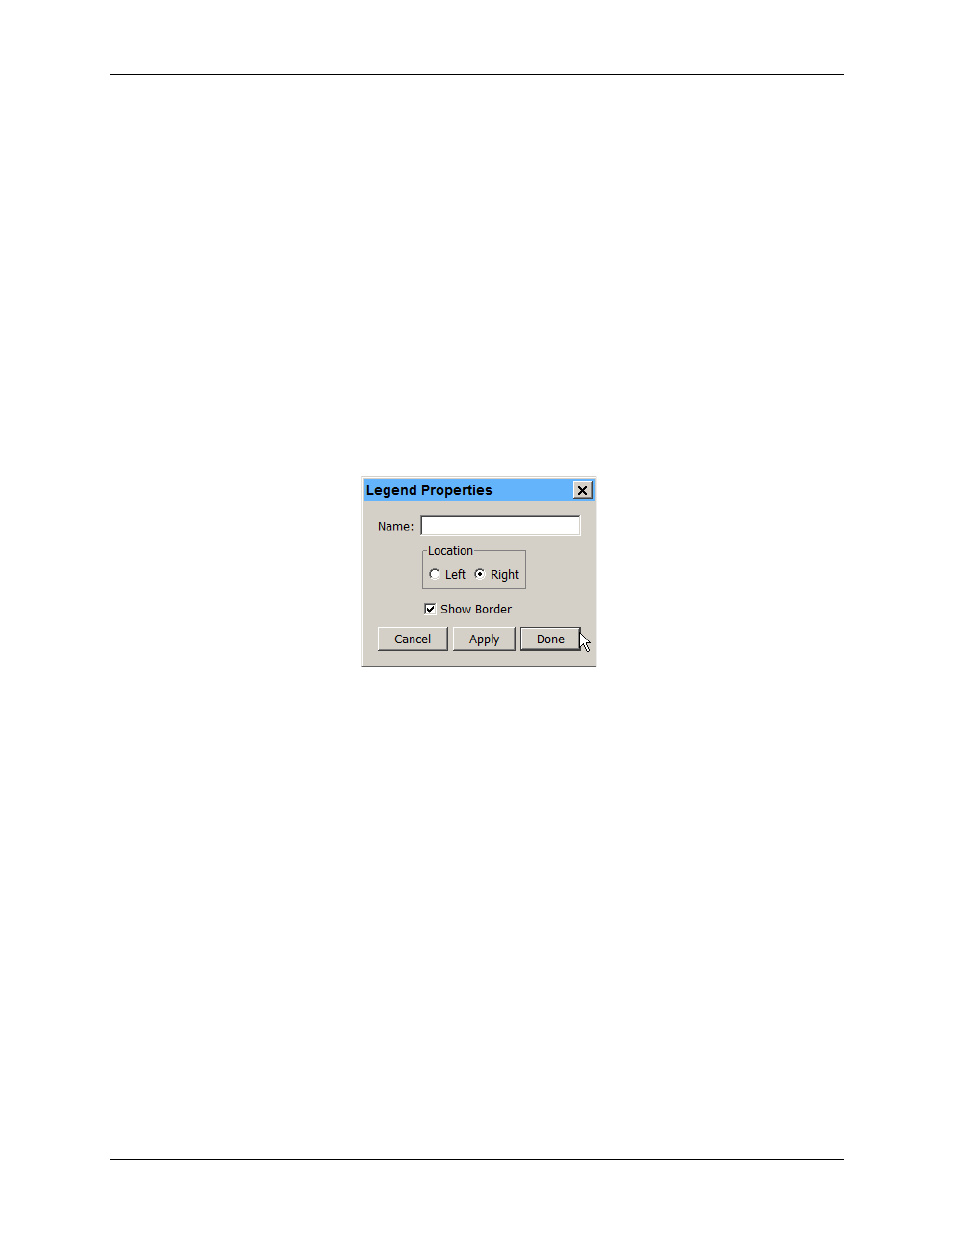
Setting Legend Properties
To change the Legend properties, complete the following steps:
1. Double-click the Legend or right-click the plot with the arrow tool and select
Other Graph Items»Legend
Properties
from the context menu.
2. In the
Legend Properties
dialog box, type a name for the Legend if desired.
Figure 20. Legend Properties Dialog Box
3. Select the location to either the left or right of the plot.
4. Select the
Show Border
checkbox to have a box around the legend. Clear this if you do not want the box
around the legend.
5. Click
Apply
to update the plot and keep the
Legend Properties
dialog box open. Click
Done
to update the
plot and close the dialog box.
38