Inserting breakpoints, Viewing breakpoints, Inserting breakpoints viewing breakpoints – Zilog EZ80F916 User Manual
Page 327
UM014423-0607
Using the Debugger
ZiLOG Developer Studio II
eZ80Acclaim!
®
User Manual
307
Inserting Breakpoints
There are three ways to place a breakpoint in your file:
•
Click on the line of code where you want to insert the breakpoint. You can set a
breakpoint in any line with a blue dot displayed to the left of the line (shown in Debug
mode only).
Click the Insert/Remove Breakpoint button (
) on the Build or Debug toolbar.
•
Click on the line where you want to add a breakpoint and select Insert Breakpoint
from the context menu. You can set a breakpoint in any line with a blue dot displayed
to the left of the line (shown in Debug mode only).
•
Double-click in the gutter to the left of the line where you want to add a breakpoint.
You can set a breakpoint in any line with a blue dot displayed to the left of the line
(shown in Debug mode only).
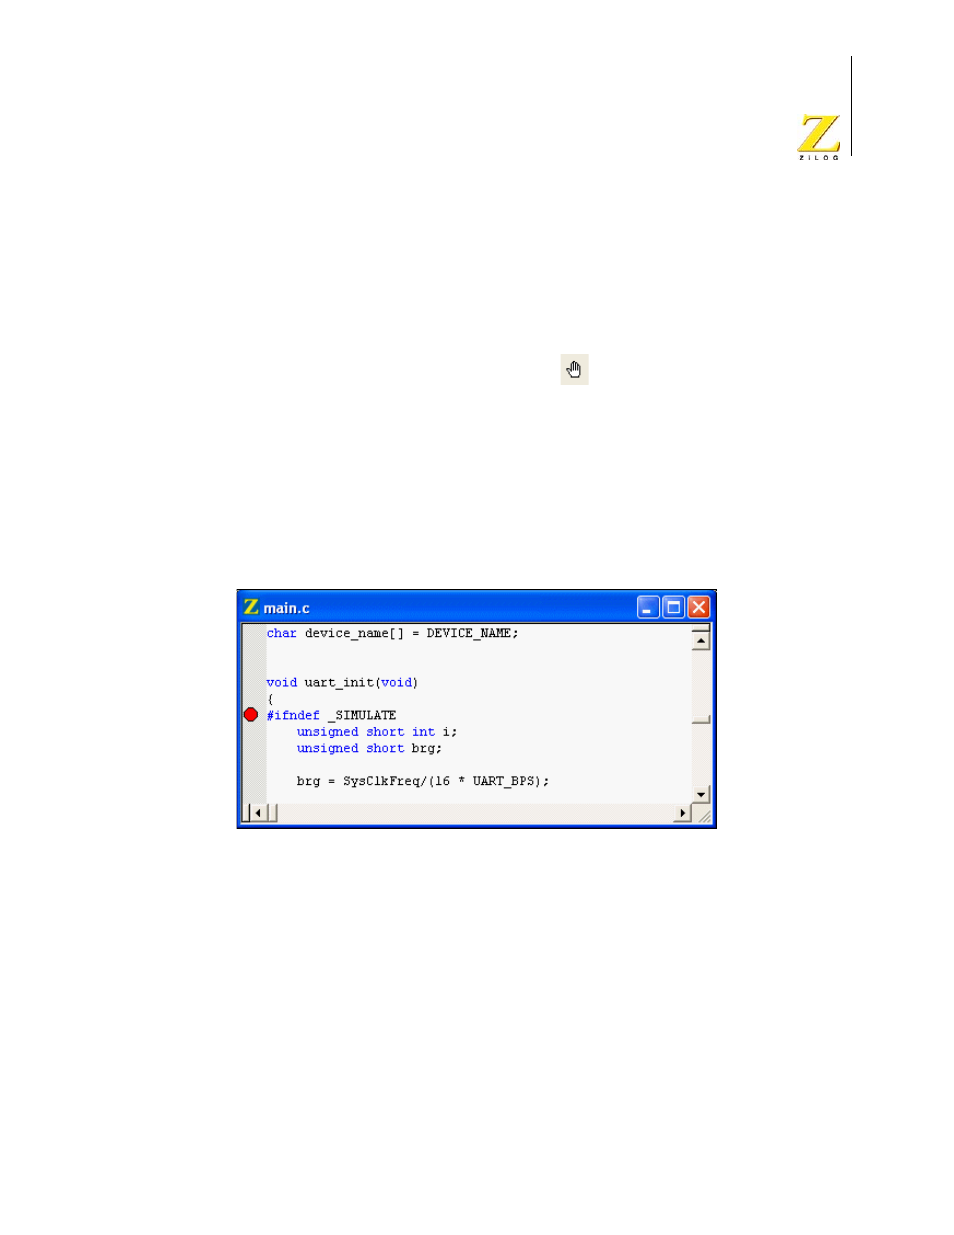
A red octagon shows that you have set a breakpoint at that location.
Figure 109. Setting a Breakpoint
Viewing Breakpoints
There are two ways to view breakpoints in your project:
•
Select Manage Breakpoints from the Edit menu to display the Breakpoints dialog
box.
•
Select Edit Breakpoints from the context menu to display the Breakpoints dialog
box.
You can use the Breakpoints dialog box to view, go to, enable, disable, or remove break-
points in an active project when in or out of Debug mode.