Comtech EF Data NetVue Release 1.1 User Guide User Manual
Page 72
Operations
Revision 3
NetVue User Guide
MN-NETVUE
2–39
Examples of some of the many Dashboard applications:
•
List of real-time amplifier KPI
•
Collection of data from different devices in a satellite uplink site to provide a single real-time overview
of the key parameters
•
Compact real-time view on the status of all ports on a Cisco switch
•
Aggregated view for Service(s) and their
statuses
•
Consolidated overview of all business SLAs,
with key parameters
•
A collection of spectrum thumbnails for an
overview of RF integrity for incoming satellite
feeds and uplinks, HFC return paths, etc.
•
A real-time overview of all KPI supplied by test and measurement solutions distributed in the
operational environment
•
A list of all business high speed data connections and their key readings
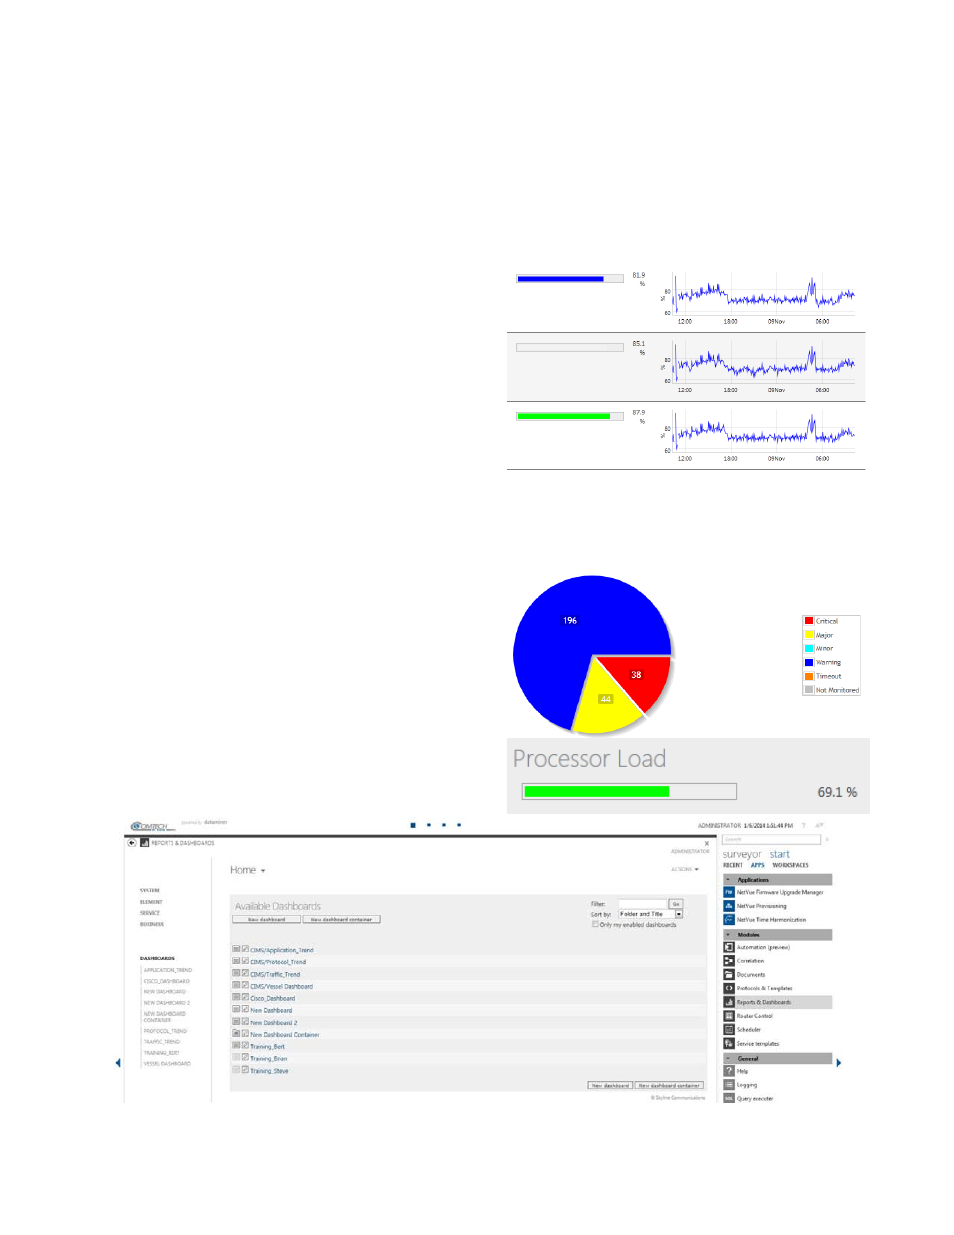
Examples of Dashboard Components:
•
Alarm indicator for Elements/Services/SLAs
•
Real-time data
•
Fixed text or titles
•
Alarm indicator for Parameters
•
Trend graph or values for Parameters
•
Alarm quantity pie diagram
•
Percentage of time in Alarm pie diagram
Figure 2-29 NetVue Report/Dashboard