Plotting data, Multiple plots – Measurement Computing eZ-TOMAS version 7.1.x User Manual
Page 23
eZ-TOMAS & eZ-TOMAS Remote
988490
File Menu 2-12
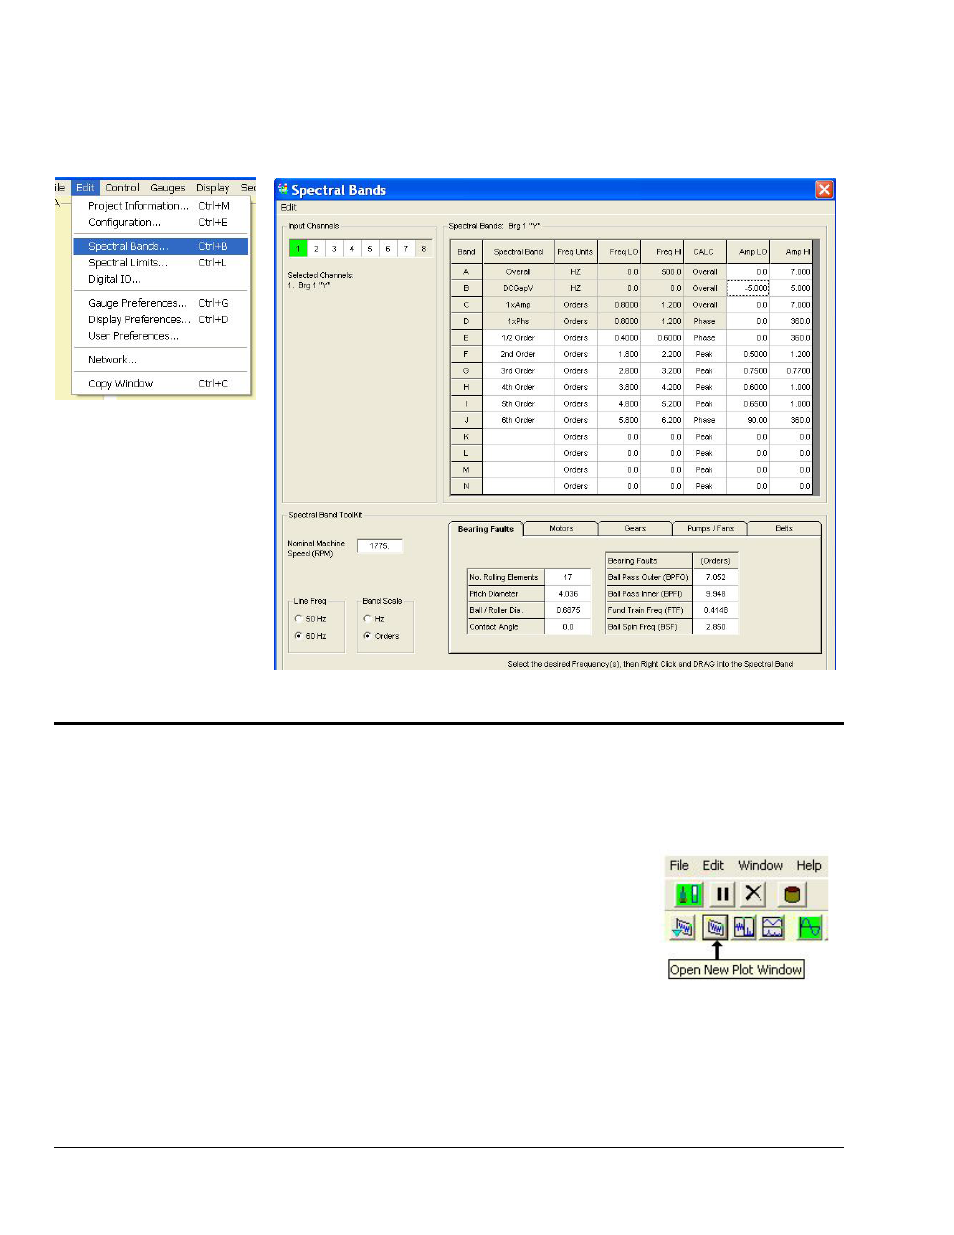
The “Spectral Bands” selection in the Edit-menu opens up a window which resembles the following. Making changes in this
window will impact the Gauge Window.
Refer to Chapter 3 for details on this and other aspects of the Edit menu.
Plotting Data
Click on “Display” in the main window’s menu bar, then select “Plot Windows.” The Data Display
Window will open. Note that you can double-click on a gauge to open the Data Display Window to plot
data for that specific channel.
Multiple Plots
1. On the second row of the Plot Windows toolbar, click the
<Open New Plot Window> button (see figure). This opens a second
display window. As an alternative to using the button you can open a
new Window from the Window pull-down menu.
2. On the Window pull-down menu of the Plots window, select either
Tile Vertically or Tile Horizontally.
All display windows will be shown simultaneously.
3. Select the Channel(s) and Display type for each window.