Measurement Computing eZ-TOMAS version 7.1.x User Manual
Page 68
Advertising
eZ-TOMAS & eZ-TOMAS Remote
887491
Display Menu … Plots Plot Examples 7-7
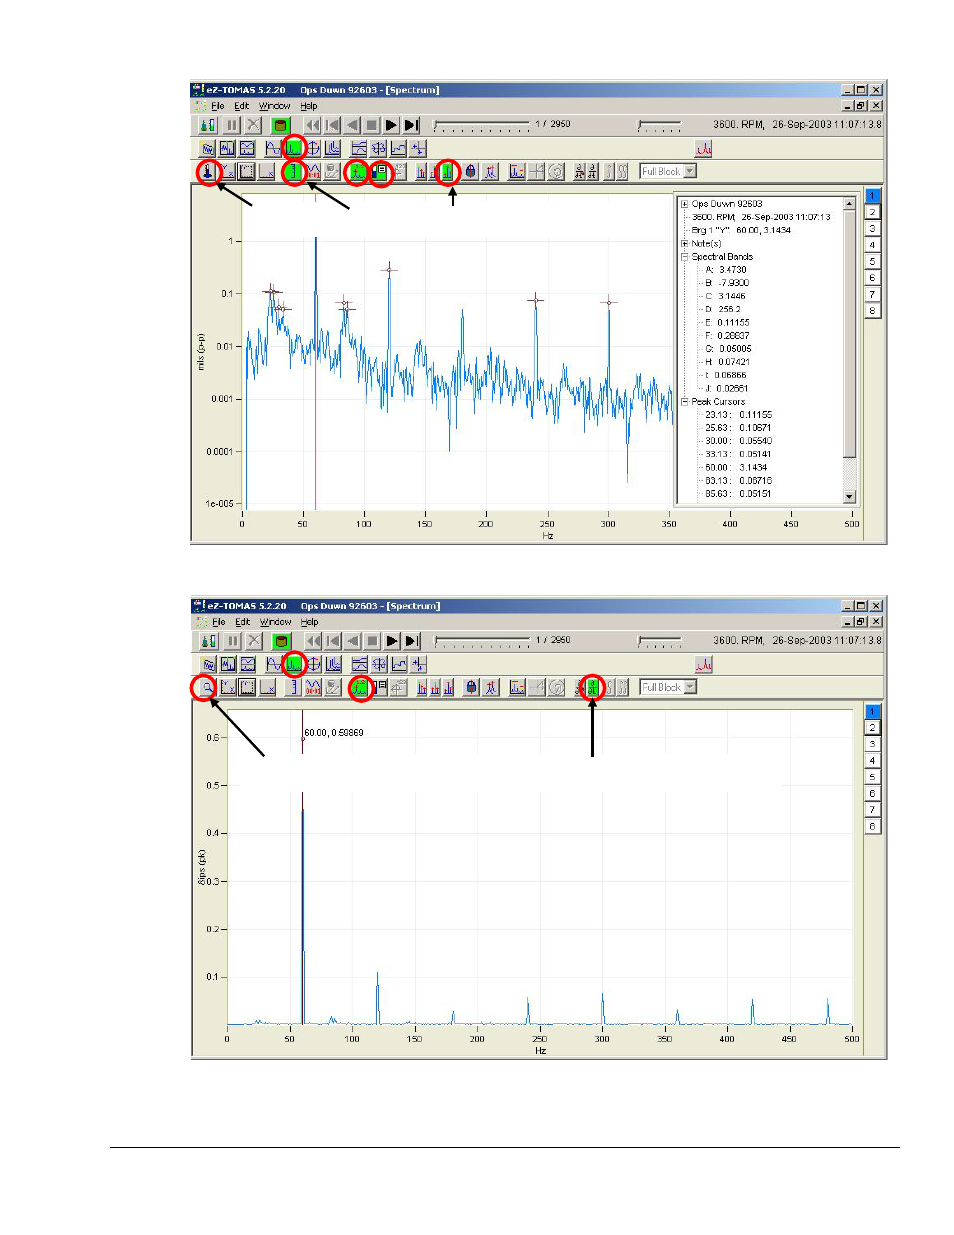
Spectrum, Fig. 3
- Channel 1, Log Scale, Cursor plus Peaks with Frame Annotation, X-axis is in Hz
Spectrum, Fig. 4
- Ch 1, Auto Scale, Cursor, X-axis is in Hz, Single Differential (Displacement to Velocity)
INSTRUMENT LOG SCALE PEAK CURSORS
SCALE
AUTO SCALE
SINGLE DIFFERENTIAL
(DISPLACEMENT TO VELOCITY)
Advertising
This manual is related to the following products: