Channels – Measurement Computing eZ-TOMAS version 7.1.x User Manual
Page 58
eZ-TOMAS & eZ-TOMAS Remote
928092
Display Menu … Plot Windows 5-7
Channels
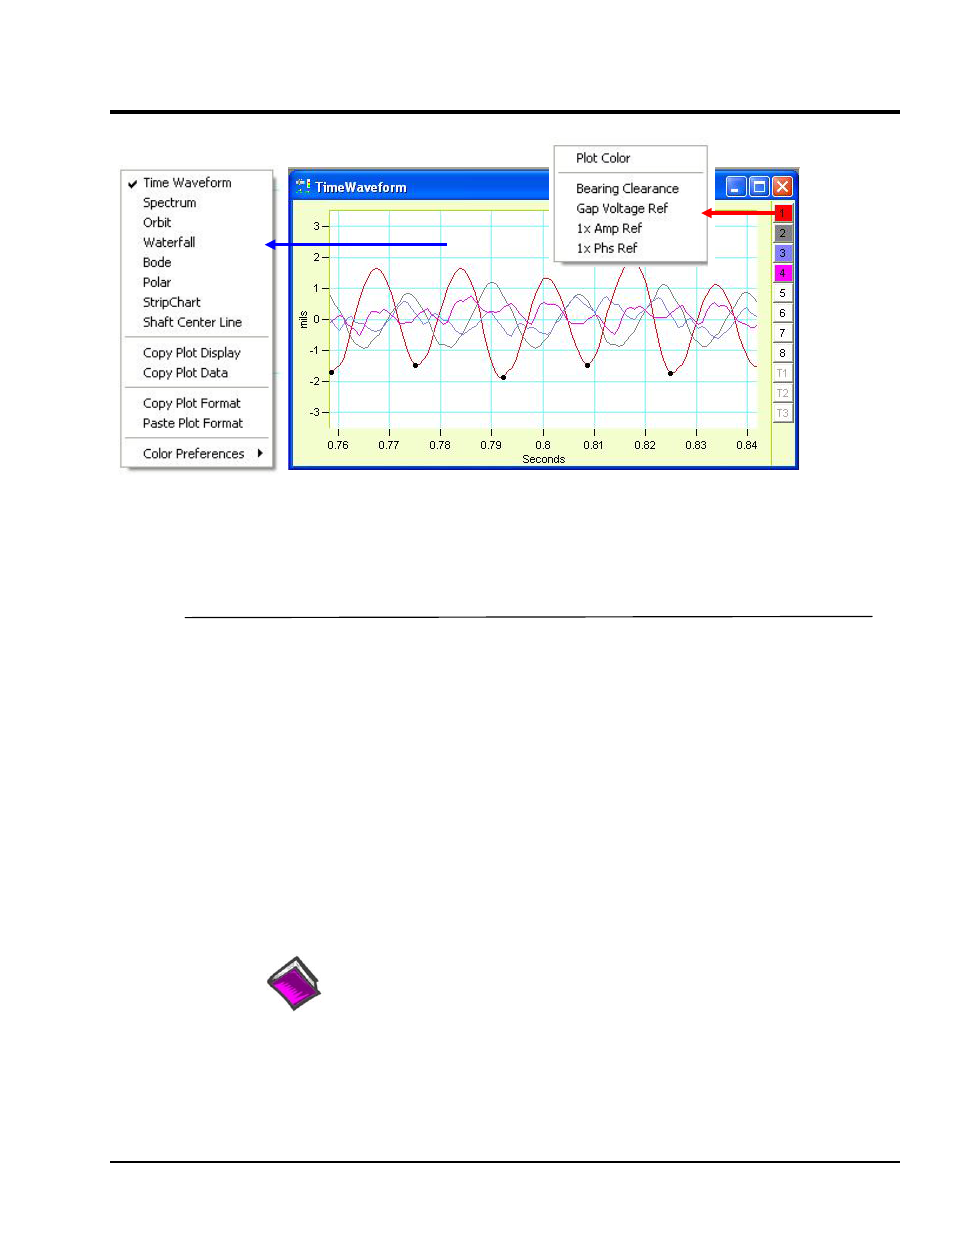
A Time Waveform Display of 4 Channels
* Right-clicking on a channel button brings up a menu (see figure) which allows for changing some of the
display characteristics for that channel, such as the color of the plot [channel trace].
** Right-clicking anywhere in the plot display area brings up a menu of many display options. Refer to the
menu at the left, in the above figure.
The vertical channel bar at the right-hand edge of each plot represents the input channels. The number of
channels that can be displayed is dependent on the plot display format. Some points regarding channels
follow.
• A color-filled channel box indicates that the channel is currently being displayed as a trace of
matching color.
• A white channel box indicates that the channel is active, but is not being displayed.
• A dimmed channel number is not active, thus there is no data to display.
• Multiple channels can be plotted on Time, Spectrum, Strip Chart, and Bode displays.
Examples of plot types are provided in Chapter 7.
• A single channel can be plotted on Waterfall, Polar, and Shaft Center Line displays.
• For Orbit displays and for Shaft Centerline displays, the time display of a channel pair is
displayed.
Reference Notes:
For toolbar button functions refer to Chapter 6.
For examples of various plot display types refer to Chapter 7.
*
**