5 - display menu... plot windows, Display menu . . . plot windows 5, Introduction – Measurement Computing eZ-TOMAS version 7.1.x User Manual
Page 52
eZ-TOMAS & eZ-TOMAS Remote
928092
Display Menu … Plot Windows 5-1
Display Menu . . . Plot Windows
5
Introduction …… 5-1
Saving and Recalling Plot Setups …… 5-3
Changing Display Ranges and Scales …… 5-4
“Real Time” Plot Controls …… 5-5
“History Data” Plot Controls …… 5-5
Channels …… 5-7
Introduction
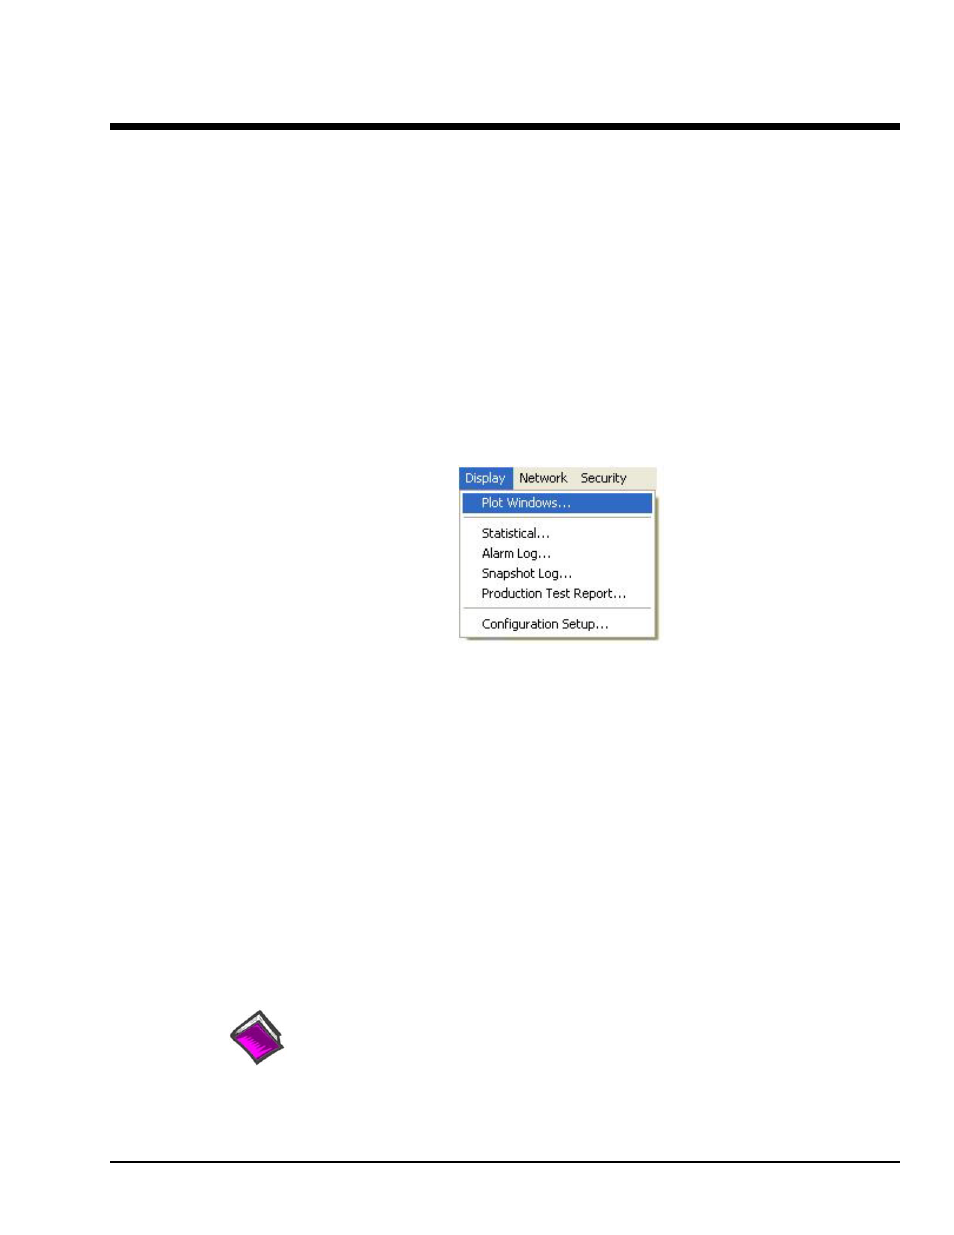
The Display pull-down menu [following figure] provides a means of displaying plot windows, logs, and
reports. This chapter covers the Plot Windows aspect. Chapter 6 pertains to the various logs (reports) that
can be generated from the menu.
Select Plots from the Display Pull-down Menu
Selecting Plot Windows from the Display pull-down menu opens a Data Display window (see following
Window). Note that you can double-click on a gauge to open a Data Display window for plotting that
gauge’s data.
For real-time displays, you can halt and resume the display of data by using the Pause/Continue toggle
button, or use the “P” key on the keyboard. When viewing historical data, you can use the playback buttons
and the slider to navigate through the data.
You can view either real-time data or historical data. In the examples that follow we are view historical
data, thus the History button has been clicked, and appears “active” [green] on our screen.
Prior to viewing a plot you need to:
• select the channels to be displayed
• select the desired data display format, e.g., Time Display, Spectrum, or Waterfall
• select the data source, i.e., a “Real Time” source, or a history data file.
Reference Notes:
For toolbar button functions refer to Chapter 6.
For examples of various plot display types refer to Chapter 7.