Strip chart displays – Measurement Computing eZ-TOMAS version 7.1.x User Manual
Page 80
Advertising
eZ-TOMAS & eZ-TOMAS Remote
887491
Display Menu … Plots Plot Examples 7-19
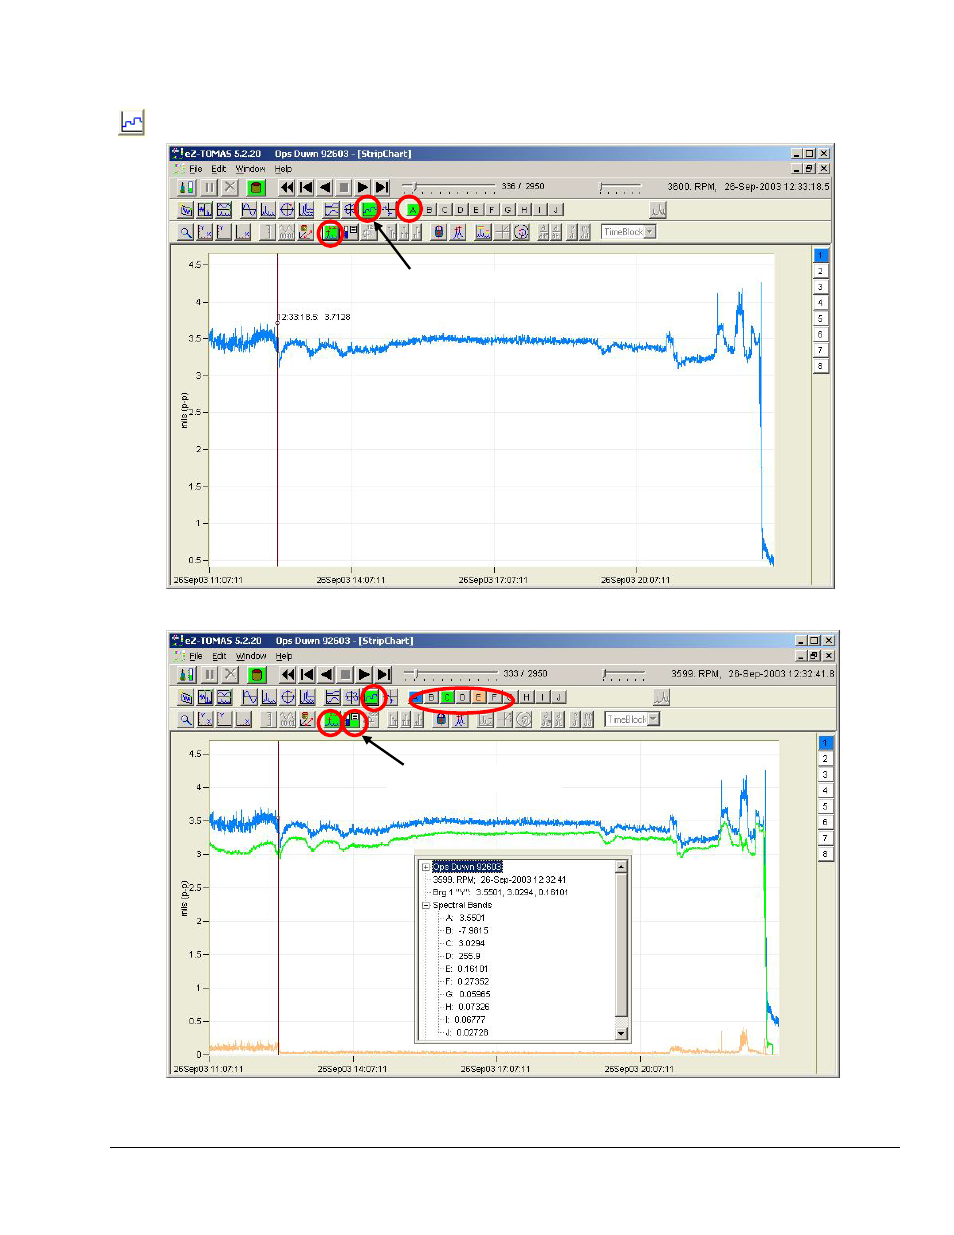
Strip Chart Displays
Strip Chart Displays show selected instrument gauge values as a function of date and time. Five examples follow.
Strip Chart, Fig. 1
- Channel 1, Overall, Cursor
Strip Chart, Fig. 2
- Channel 1, Overall & 1xA & 2xA, Cursor with Frame Annotation
STRIP CHART
FRAME ANNOTATION
Advertising
This manual is related to the following products: