Graphic presentation – Microsonic LCA-2 User Manual
Page 45
Visualisation of measurements
Page 45 of 51
G
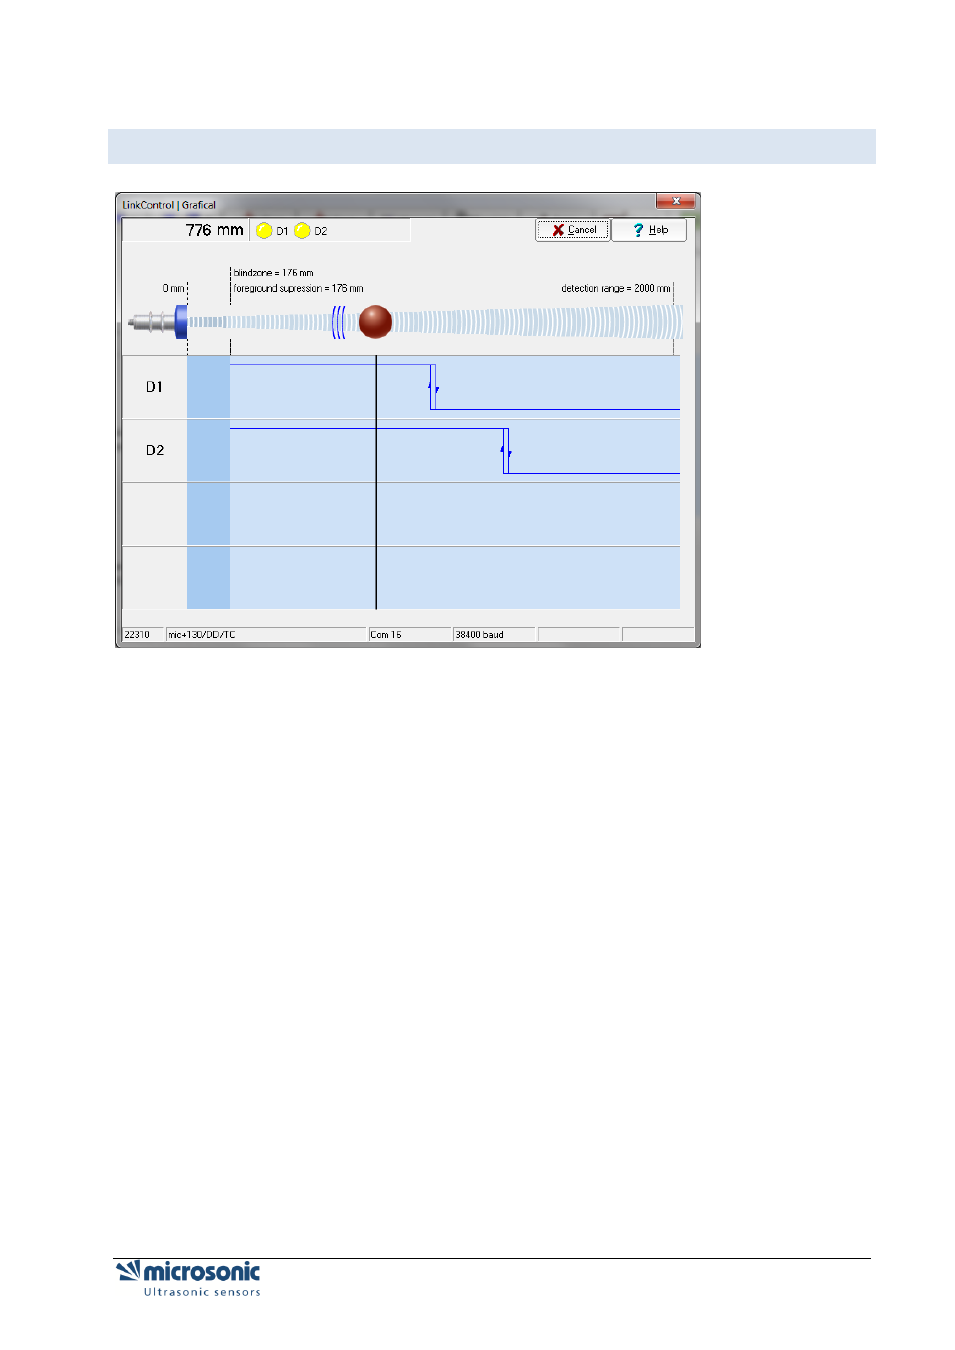
RAPHIC PRESENTATION
The displayed output characteristics correspond to the settings in the input mask.
The position of the vertical line below the target (red wall) changes proportional to the measured distance.
The expected output voltage and the expected output current is calculated on the values as given in the
input mask and showed in the lower part of the window; thus they should match with the actual analogue
signal on the sensor output (within the specified accuracy). To have correct results the values in the input
masks have to be identical to the values stored in the sensor!
The LED's D1 and D2 are showing the required state of the switching output S1 and S2, respectively the
analogue output. To have correct results the values in the input masks have to be identical to the values
stored in the sensor.