Dual channel modes, The spectragraph and controls, Instruments 26 – Metric Halo SpectraFoo User Manual
Page 26
Instruments
26
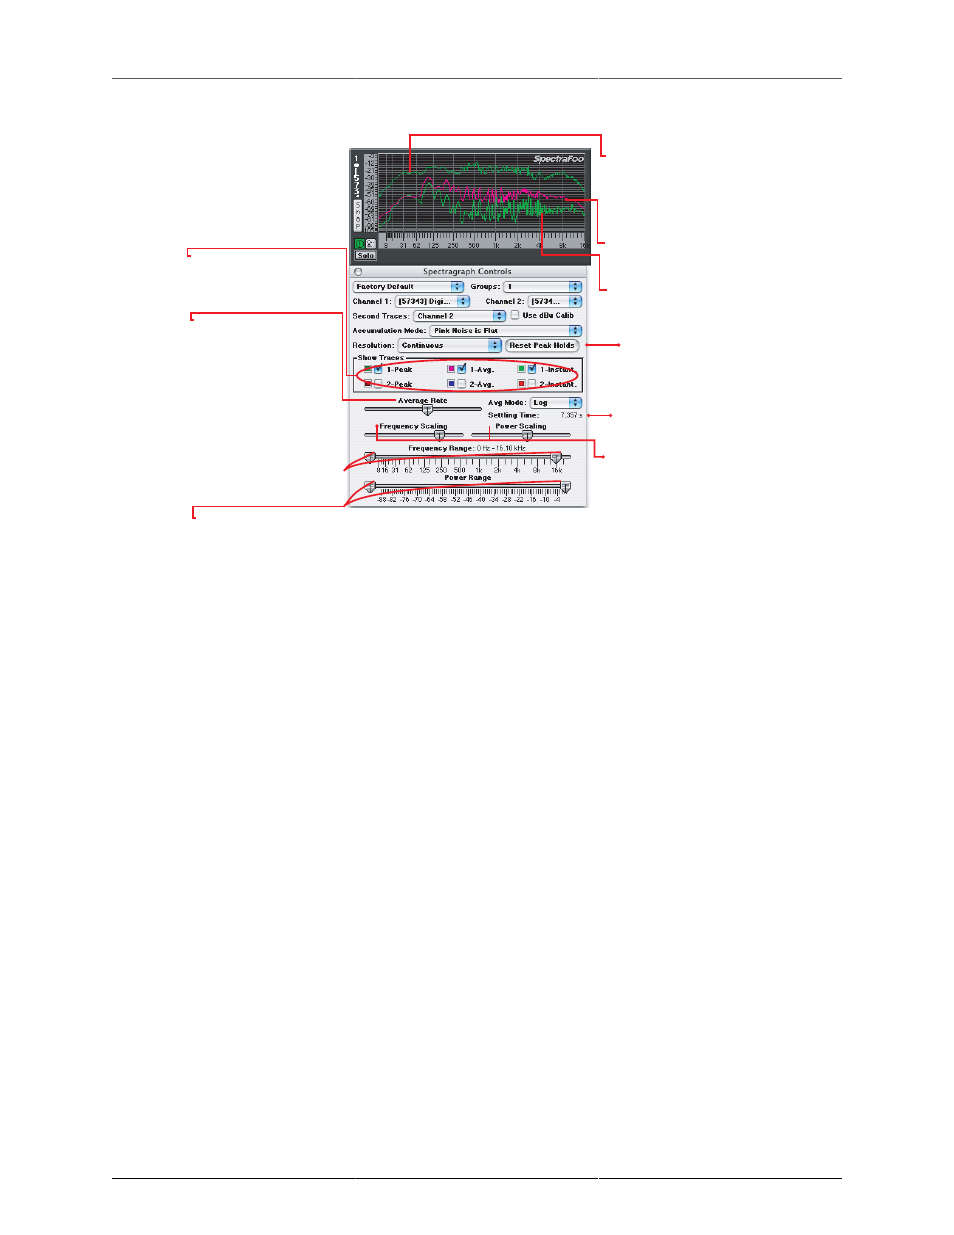
Peak Hold Trace: Displays the maximum
amplitude per frequency bin since the
peak hold was last reset. To reset the
peak hold either click on the instrument
itself or click on Reset Peak Holds in the
details window.
Instantaneous Trace: Displays the current
level of the signal at each frequency.
AverageTrace: Displays the average
level of the signal at each frequency.
These checkboxes show and hide
the traces, allowing you to focus
your attention on any combination
of traces.
Click to reset the peak trace.
Sets the averaging rate for the
average trace. When you move
this slider, the ballistics of the
average trace will change in
realtime.
Gives a precise numerical reading of the
settling time of the average trace.
Use these sliders to change the low
and high frequency limits that the
Spectragraph applies to its display.
This lets you zoom in on a particular
frequency range. As you change
the low and high frequency limits,
the frequency calibration on the
bottom of the Spectragraph will
instantly rescale itself.
Use these sliders to change the low and high power limits that the Spectragraph applies to its display.
This lets you zoom in on a particular power range. As you change the low and high frequency limits,
the power calibration on the left side of the spectragraph will instantly rescale itself.
The Frequency Scaling and Power
Scaling sliders allow you to adjust the
scaling of the frequency and power
calibrations. When the slider is set to its
far left limit, the scale is roughly linear.
When the slider is set to its right limit,
the scale is logarithmic. The best way to
get a feel for scaling, is to simply grab a
slider and move it back and forth.The
frequency and power calibrations will
track your movements in realtime and
useful scaling settings will quickly
become obvious.
Figure 3.8: The Spectragraph and controls
The Spectragraph utilizes a triple display for each input channel. The bright green trace provides instantaneous
spectral analysis. The purple trace shows the average spectral content referenced over a user specified length
of time; this is controlled from the Details window. The dark green trace represents the peak spectral power
monitored since the peak was last reset. Using the Details window, you can alter the Spectragraph’s frequency
and power scaling as well as its averaging characteristics in realtime. This allows you to easily focus on very
fine details. In addition, the Control window allows you to adjust the colors assigned to each trace.
Dual channel modes
The Spectragraph can run as a 6 trace, dual channel instrument, allowing you to route any two channels to
one Spectragraph window. For example, you could route the left and right channels of a stereo pair into a
Spectragraph.