Log and linear averaging, Spectral snapshots, overlays & libraries, 33 spectral snapshots, overlays & libraries – Metric Halo SpectraFoo User Manual
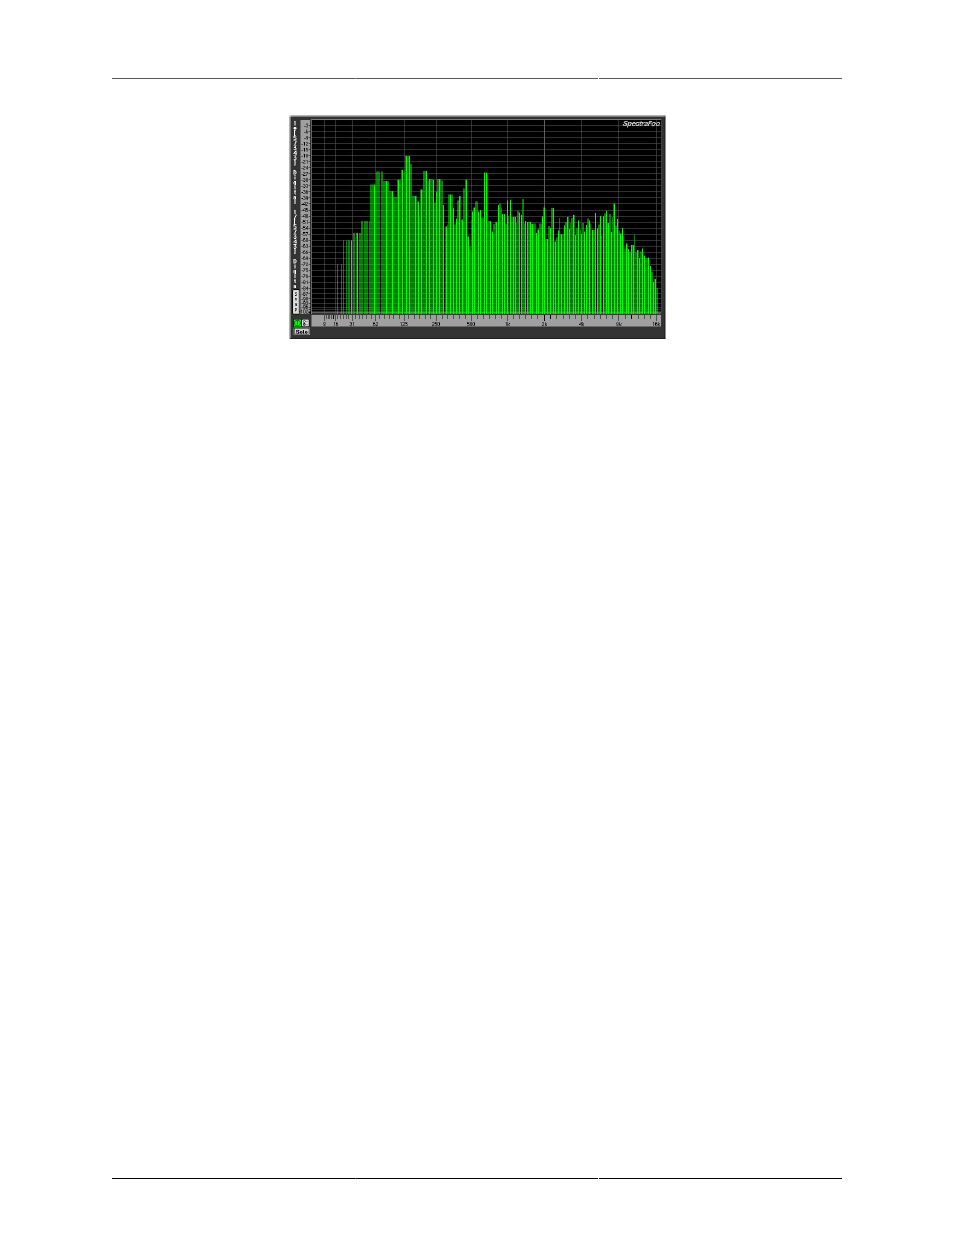
Page 33: 1/24 octave display resolution
Instruments
33
Figure 3.24: 1/24 octave display resolution
Log and linear averaging
There are two natural ways to average the power spectrum of an audio signal. The first method, which corre-
sponds to SpectraFoo’s Log Averaging Mode, averages the power data after it has been converted to decibels.
It is consistent with a visual average of the trace in the display, and mathematically it corresponds to averaging
the level in decibels. An average computed this way would be, for example, (1 dB + 2 dB)/2 = 1.5 dB. While
this is not mathematically correct and appears to over-represent the contribution of low-level signals, it is still
useful as a measurement tool.
The second mode, which corresponds to SpectraFoo’s Lin Averaging Mode, and is mathematically correct,
averages the actual power level and then takes the logarithm of the average to give the level in dB. This give the
true average level of the signal, but does not correspond to the expected visual average. With this averaging
mode (1 dB + 2 dB)/2 = 1.5144 dB which is mathematically correct. This difference is not trivial. Consider the
average of -10 dB and -40 dB. The Log average is: (-10 dB - 40 dB)/2 = -25 dB. The linear average is (-10 dB
- 40 dB)/2 = -15.75 dB. As stated, the Log average over-weights low level signals.
Log Averaging is more useful for showing overall spectral balance in the monitored material. This is probably
because the human ear over-weights low level signals in much the same way that Log averaging does. For
building EQ curves, linear averaging makes the same average measurement as what an EQ will see. Not
surprisingly, we have found the Linear Averaging mode works better when attempting to capture spectral
templates of material for matching purposes.
Spectral Snapshots, Overlays & Libraries
You can use the Spectragraph to create spectral snapshots and save them as library files. The library file that
is created does not contain the actual audio samples that the spectragraph was analyzing, but rather the trans-
formed Fourier power data that the Spectragraph uses to draw its traces. This allows you to take spectral snap-
shots of sounds and post-process them at a later time. You can take a number of snapshots and average them
to form a new average snapshot. You can also use a pair of snapshots to create a transfer function which can
be displayed in the Transfer Function Window [SFC].
To take a spectral snapshot:
1. Route a sound that you want to take a snapshot of to a Spectragraph.