Online measurement / data in form of a graph, Sampling rate – Amprobe PQ55A Power-Analyzer User Manual
Page 32
The file name may consist of the current date and must consist of the .mes file index.
☞
If more than 10000 measured values are saved, the measured values will be
saved automatically. The file name consists of the date and the current time, e.
g. 1002132833.mes [Date 02.10., time 13:28:33]. After having saved the measure-
ment, it will be carried on with the measured value no. 10001. The same applies
to the next or all further 10000 measured values.
Click the button to print the values in form of a table.
Online measurement / data in form of a graph
Click the (d) [Insert graph] button to start the online measurement.
The input signals are represented in form of a graph over an extended period of
time.
Click the graph to zoom it up.
☞
For the description of the other display functions and buttons, please refer
to page 29.
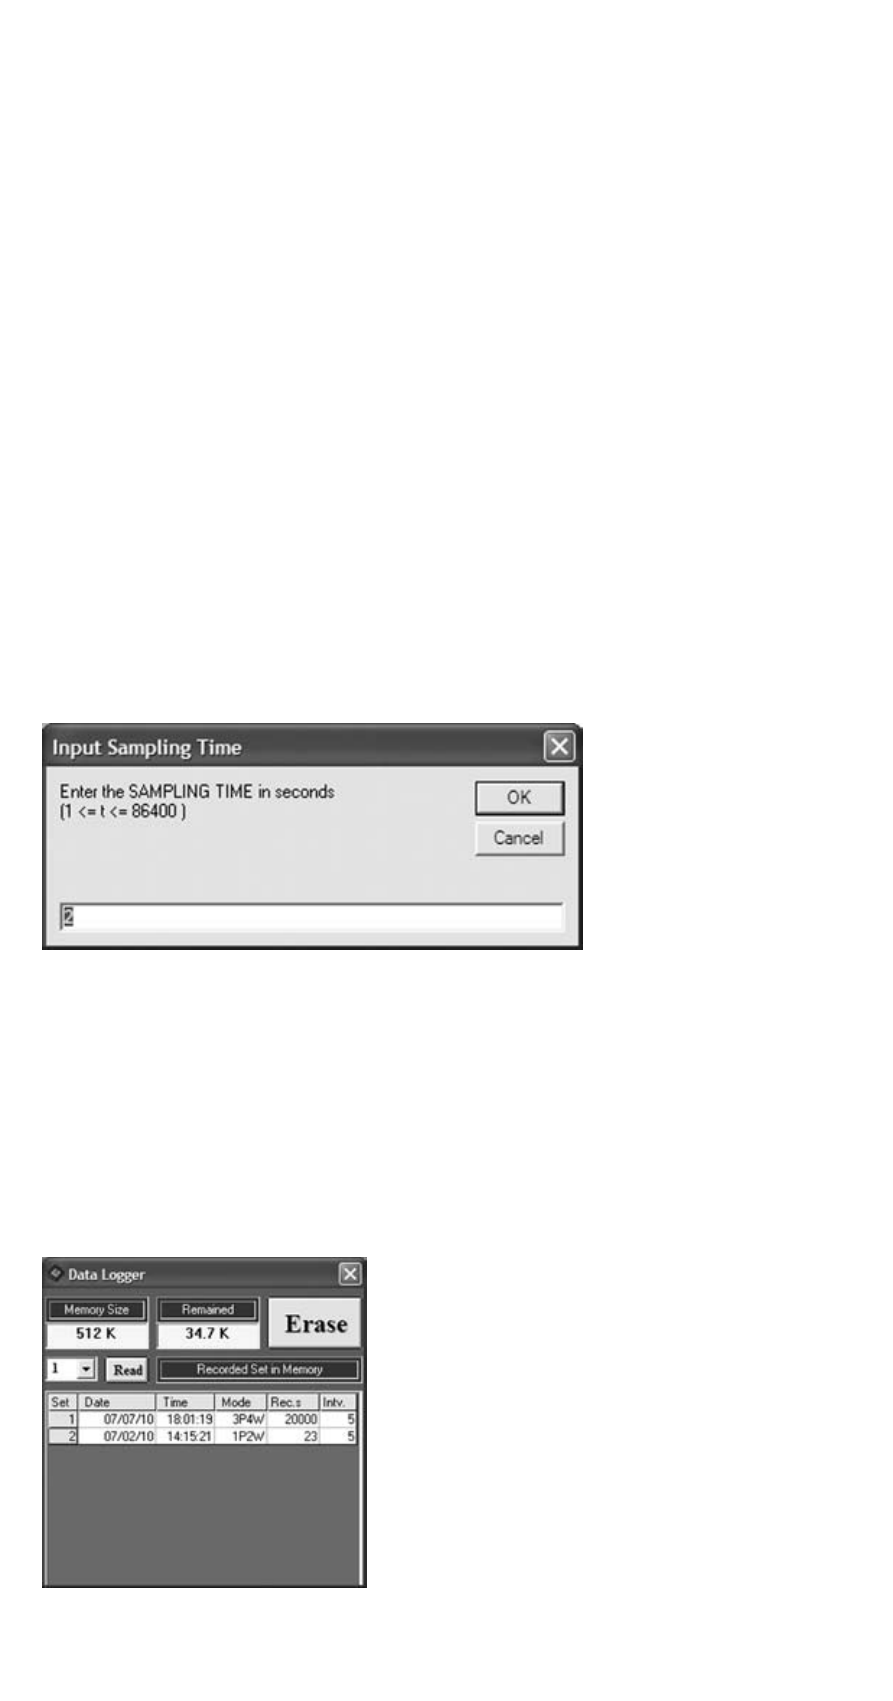
Sampling rate
Click the (e) [Insert graph] button to open the window to set the sampling rate
for the online measurement.
The permissible input values range between 1 and 86400 sec. The preset value is 2 s
Data logger – Analysis of the data saved in the measuring
instrument
Click the (f) [Insert graph] button to open the window to read the data saved in
the measuring instrument.
If there are no saved data, the following error message will be displayed:
The Memory Size field shows the value for the
max. available memory space. The Remained
field shows the free memory space.
If there are several measurements, they will be
displayed in a selection window.
To transfer a measurement, proceed as follows:
• Select the requested number of the
measurement (Set) in the adjacent
field on top and press the “Read” button.
or
• Click the requested number in the Set column
to start the transmission.
32