Reading the processing meters, Understanding the processing meters display – Omnia Audio Omnia.9/XE User Manual
Page 22
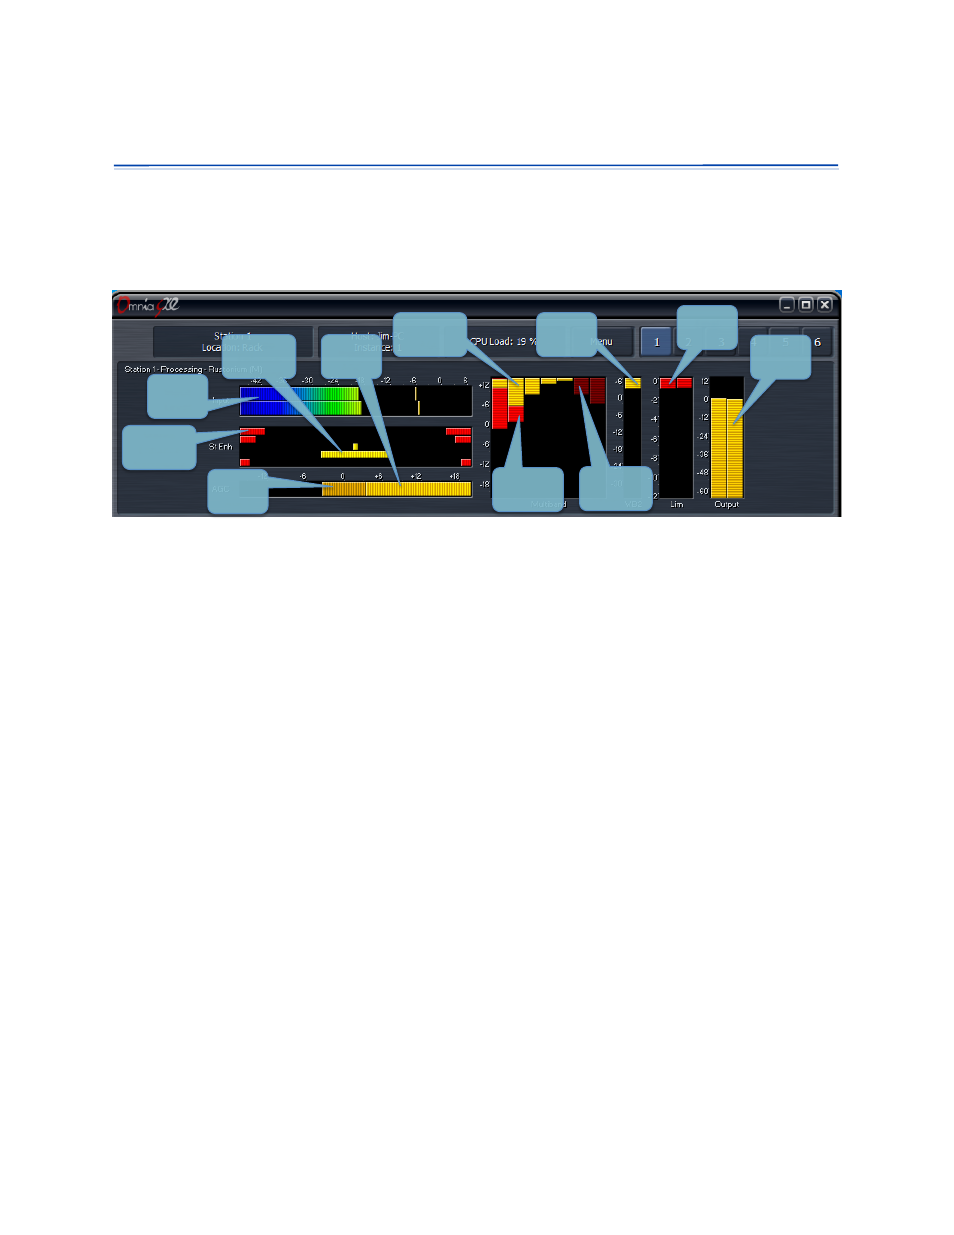
Reading the Processing Meters
Understanding the Processing Meters Display
The Processing Meters Display provides a tremendous amount of information about what’s going on
inside each of Omnia.9/XE’s processors, but in a very efficient and easy-to-read manner.
Input&
Level&
Stereo&
Enhance&
Narrowing&
Stereo&
Enhance&
Widening&
Input&
AGC&
WB&
AGC1&
WB&
AGC2&
Mul?band&
AGC&
Mul?band&
Limiter&
Downward&
Expander&
Final&
Limiter&
Output&
Level&
• The ITU BS.1770 Input meters indicate the level of the unprocessed source audio coming into
each station processed by Omnia.9/XE with floating peak indicators above each bar.
• The AGC meter window shows the levels and action of the Input AGC and the Wideband AGC1
compressors. It also shows the level of the Wideband AGC2 section when it is enabled and
positioned before the multiband section.
Depending upon the settings of the various Input and Wideband AGC1/AGC2 controls, the meter
scale can display levels below threshold (positive numbers) as well as levels above threshold
(negative numbers). When the meters dip down below “0” the compressors are above threshold
and therefore in a state of gain reduction. When they rise above “0” they are below threshold and in
a state of gain increase. The combination of Input AGC, AGC1, and AGC2 gain is added together to
determine the total amount of AGC gain in place.
• The Input AGC levels are indicated by a bright yellow bar. The Wideband AGC1 levels are shown
as a dark orange bar extending beyond the Input AGC meter. Wideband AGC2 levels (if this
compressor is situated before the multiband section) are shown as a second, darker orange bar
beyond the AGC1 meter.
• The Multiband meter window shows the levels and action of the AGC, limiter, and noise reduction
sections for each band (ranging from 2 to 7 depending upon the preset employed). As is the case
with the AGC metering section, the scale will change based upon the settings of various multiband
controls.
• The AGC level in each band is indicated by a bright yellow bar. The multiband limiter for each band
is represented by a bright red bar that flashes beneath the AGC level. The multiband noise
reduction for each band is shown by a dark red bar that appears to drop down from the very top of
the meter. Gating - the condition in which release is significantly slowed down - is indicated by a
dark red ribbon at the bottom of the multiband AGC meters. Freezing - the condition in which
Reading the Processing Meters
22