Super Systems CarbCALC II User Manual
Page 15
CarbCalcII
CarbCalc II
14
© 2005,2006,2007 Super Systems Inc.
In Simulation mode, the Temperature and Carbon Chart displays a profile of the recipe as it is
executed.
In RealTime and Replay modes, the Actual monitored values of the Temperature and Carbon
process variables and setpoints are displayed and times are displayed as actual clock times rather
than elapsed times.
2.4.5
Carbon Profile Chart
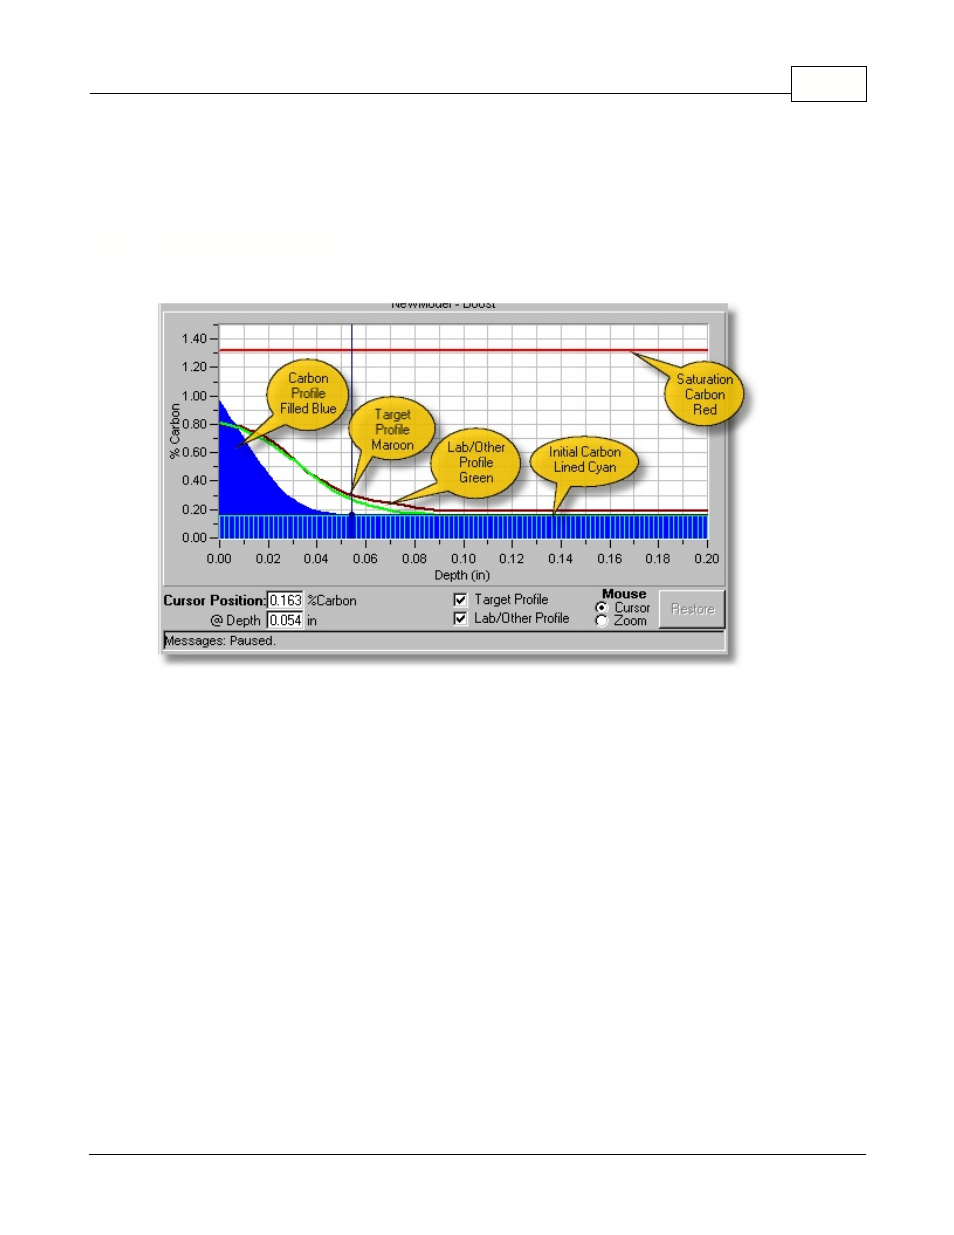
The Carbon Profile Chart displays %Carbon (Y axis) vs Depth (X axis).
·
Title - In Simulation mode, displays "Model Name - Segment Name"
In RealTime and Replay Modes, displays Load Name and Model Name.
·
Y Axis - %Carbon
·
X Axis - Depth (in inches or mm depending on model settings)
·
Cursor Position - displays the %Carbon at Depth corresponding to the cursor crosshair position.
·
Target Profile - check to display the target profile.
·
Lab/Other Profile - check to display the Lab or other imported profile.
·
Mouse Mode - places mouse in either cursor or zoom mode (default is cursor).
·
Restore Button - used to restore the chart after using the zoom mode.
·
Message box - message display.
·
Carbon Profile - primary display (filled Blue) Carbon vs Depth
·
Initial Carbon Profile - Uniform or Custom Initial Carbon Profile (Lined Cyan)
·
Target Profile - Maroon line indicating the "spec" or Target Profile
·
Lab/Other Profile - Green line indicating the imported Lab or other imported Profile.
·
Saturation Carbon - Red Line indicating the "saturation" carbon for the given furnace temperature.