Ivie ie-45 manual, Rta: peak curves, freq. detection – Ivie IE-45 RTA - Real Time Analysis User Manual
Page 13
Ivie IE-45 Manual
page
13
RTA: Peak Curves, Freq. Detection
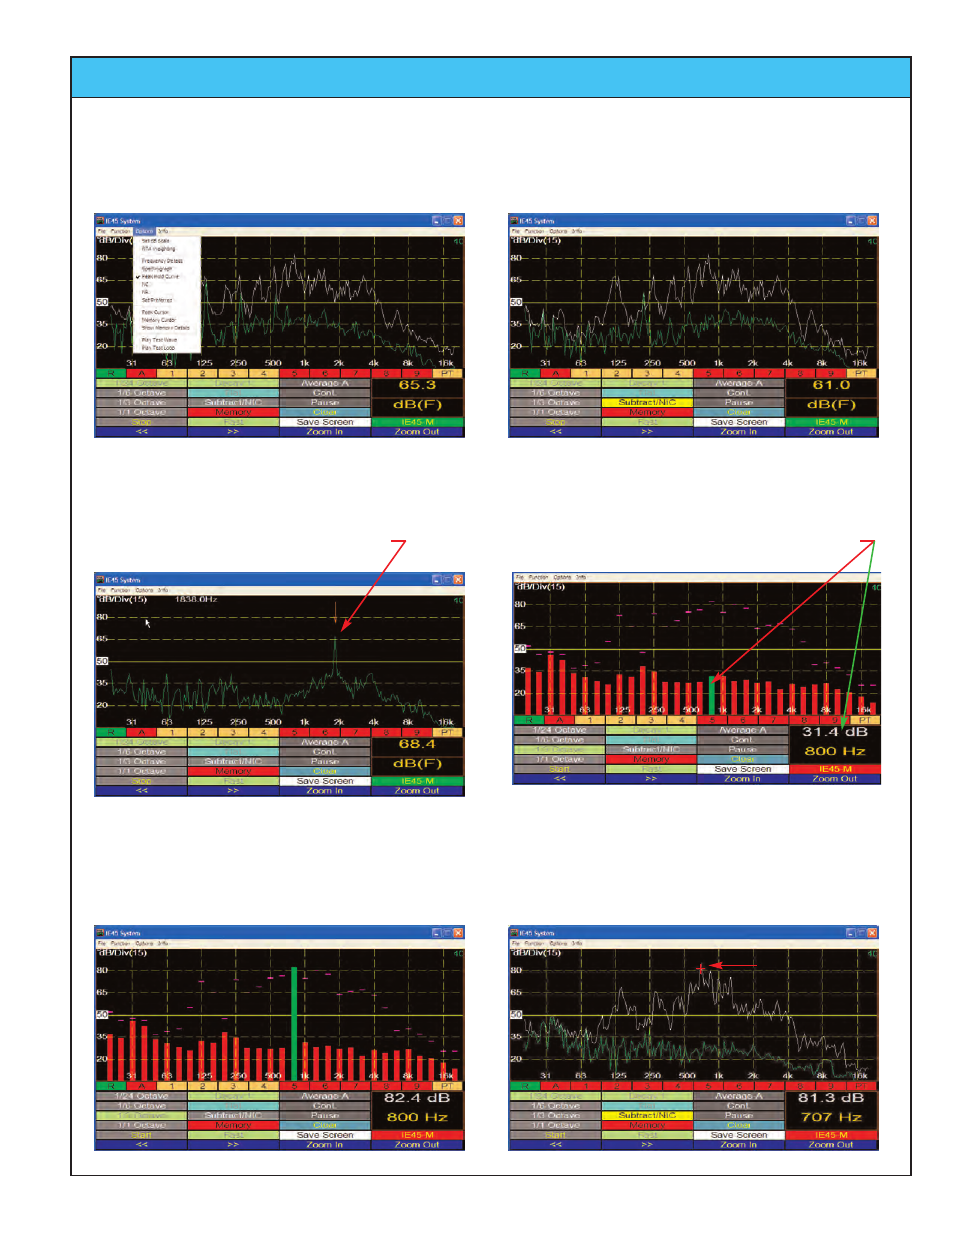
Peak Curve
RTA Curve
Displaying the Peak Hold Curve
To display the Peak Hold Curve, use the “Options” pull-down menu and select “Peak Hold Curve.” The Peak Hold Curve
will be displayed in white for the 1/12 octave display, or in pink for the 1/1 octave, 1/3 octave and 1/6 octave displays.
Frequency Detect
Frequency Detect has been turned on (using the “Options”
Pull-down menu) for this 1/12 octave display. The frequen-
cy with the highest amplitude will be indicated.
RTA Cursor
Tapping the Start/Stop cursor button will “freeze” the RTA
display. The “Joystick” or stylus can be used to select a
band whose frequency and amplitude will be displayed.
Peak Cursor
With the RTA Display “Stopped” and the Peak Hold Curve function turned on, the Peak Cursor can be turned on using the
“Options” pull-down menu. It will interrogate the peak curve in the same manner that the RTA Cursor interrogates the RTA
Curve. The Peak Cursor is a green bar for the 1/1, 1/3 and 1/6 octave displays and a red + for the 1/12 octave display.
Peak Cursor