Ivie ie-45 manual, Strip chart recorder – Ivie IE-45 RTA - Real Time Analysis User Manual
Page 31
Ivie IE-45 Manual
page
31
Strip Chart Recorder
Using the Strip Chart Recorder Function of the IE-45
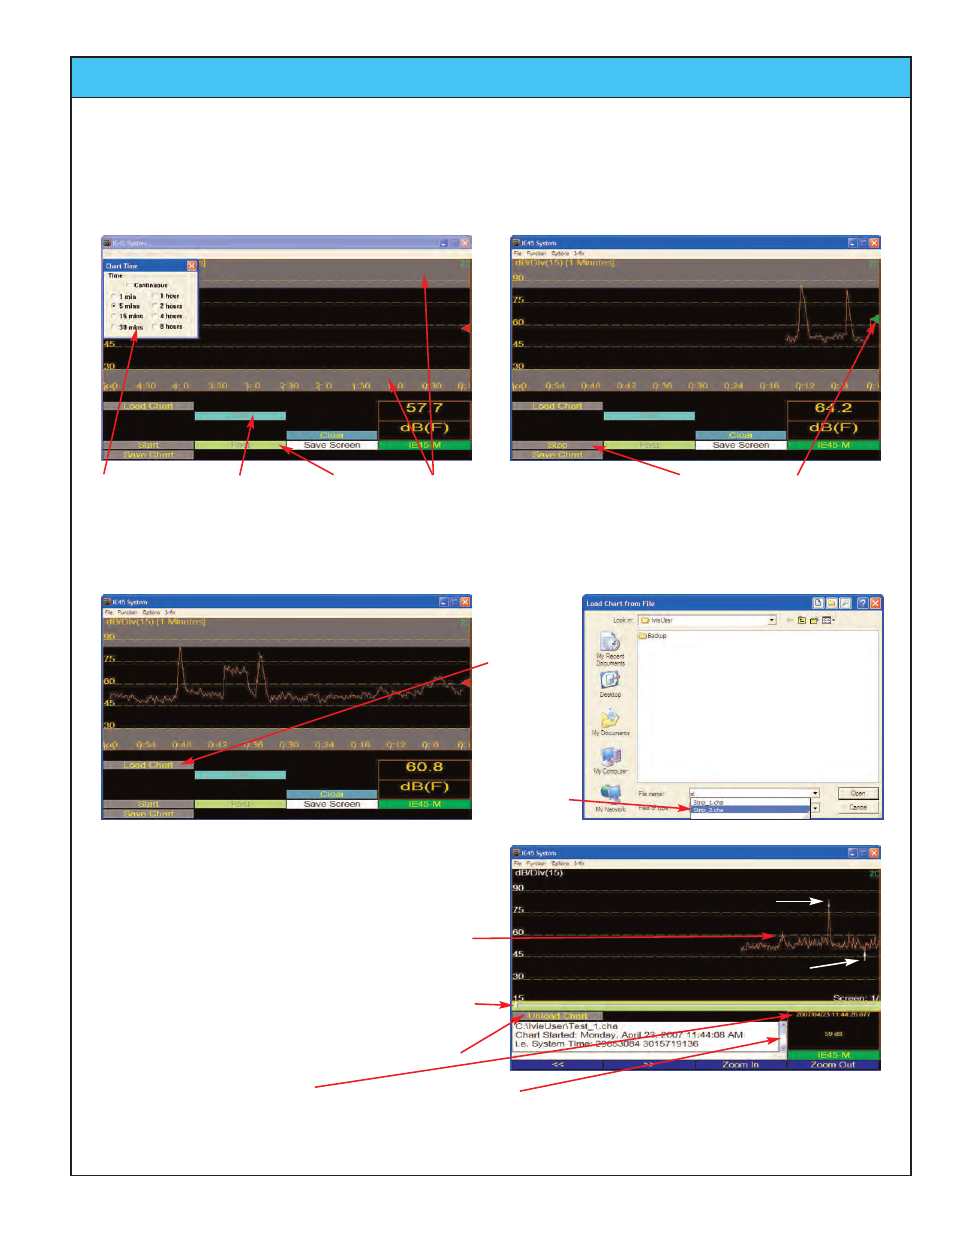
The Strip Chart Recorder function can be selected from the “Functions” menu. After accessing the Strip Chart Recorder
function, select the SPL weighting desired and the SPL detector response wanted. Next, choose the recording time required
by tapping “Options” > “Chart Time” > and then the recording time wanted. Tap the “Start/Stop” button to begin recording.
Select Chart Time
from “Options” >
“Chart Time.”
Select SPL
Weighting.
Select SPL
Detector
Response.
Press the
“Start/Stop”
Button to Begin.
Set Gray Visual areas of Interest
(Minimum/Maximum), using
“Options” >”Set dB Levels”.
Pen is Green
when Recording,
Red when Lifted.
Viewing a Previously Recorded File
When the recording has finished, a “prompt” window will
pop-up allowing you to save the recorded information. The
recording can be stopped and saved at any time during the
recording process by pressing the “Save Chart” button.
The cursor is controlled by the “Joystick,” or by tapping on
the screen with the stylus.
The Chart is displayed in an expanded form so that each
data point is represented by one pixel. The slide is used to
“Page” through the data one screen (page) at a time.
Tap to unload the file and return to the Recording screen.
Data at the Cursor point selected.
To view a
saved chart,
tap the
“Load Chart”
button. The
screen to
the right will
pop-up
allowing you
to select the
proper chart
for viewing.
Scroll through data including: File name, Test date/time,
Total number of data points, Sample interval, Weighting,
Maximum SPL and time and Minimum SPL and time.
Maximum data point
Minimum data point