Verilink PRISM 3000 (34-00184) Product Manual User Manual
Page 25
Operation
3-9
PRISM 3000
Pattern Sync Losses: This field displays the number of
times during the test period that the BERT pattern
detector lost sync.
Reset Bert Test: When set to ‘
YES
’, the BERT error
counts and elapsed time values are cleared to zero. This
parameter then returns to ‘
NO
’ automatically.
Network Performance Stats: The PRISM records perfor-
mance statistics as described in TR54016. The unit is
equipped with a dual set of data registers with individual
resets that maintain these statistics. One set is accessed by
the network service provider (telco). The other set is
accessed by the user through the front panel, terminal inter-
face, or the EM8000 element manager.
Performance data is collected in 15-minute intervals for the
preceding 24-hour period. The intervals (numbered Int# 00
to Int# 96) are viewed by pressing <Select> and using the up
and down arrow keys. Interval 00 is the most recently stored
interval and interval 96 is the interval which is 24 hours old.
Pressing the <Exit> or <Select> keys returns the cursor to
the left. This allows scrolling to another data type.
When a specific interval is selected for viewing performance
data, all other parameters will reflect that interval until
another interval is selected.
Errored Seconds:
ES
displays the number of one second
intervals where at least one CRC or out-of-frame error
event occurred.
Severely Errored Secs:
SES
displays the number of one
second intervals where at least 320 CRC errors were
detected or at least one out-of-frame event occurred.
Loss of Frame Secs:
LOFS
displays the number of sec-
onds that the network interface is out of frame sync.
Unavailable Seconds:
UAS
displays the number of one
second intervals of unavailable service. Counting begins
when 10 consecutive severely errored seconds (CSES)
occur and ends when 10 consecutive seconds pass with no
SES. The initial 10 seconds are included in this count.
Controlled Slip Seconds: CSS displays the number of one
second intervals where at least one controlled slip
occurred.
Bipolar Error Secs: BPES displays the number of one
second intervals where at least one bipolar code violation
occurred.
Daily performance data for the parameters listed above
appears following the 15-minute interval listings. It is col-
lected in 24-hour intervals for the preceding 30-day period.
The days (from
Day# 00
to
Day# 30
) are viewed by press-
ing <Select> and using the up and down arrow keys.
Day# 00
is the most recently stored day and
Day# 30
is the
oldest day. Pressing the <Exit> or <Select> keys returns the
cursor to the left.
ESF Errors: Displays the total number of ESF error
events since the counts were last reset. This value is not
T1
Network
Loop
Network
Alarms
None
Near
Send Loop
Send Unloop
None
Signal Loss
Sync Loss
AIS
Yellow/Remote
Network
Performance
Statistics
Clear ESF Stats
BERT
Function
T1
DTE
Loop
None
LLB
T1
DTE
Alarms
Signal Loss
Sync Loss
AIS
Yellow/Remote
None
Network
T1 DTE
Port 1 - Port 4
BERT
Port
ES
SES
LOFS
UAS
CSS
BPES
ESF Errors
Sync Status
Elapsed Time
Bit Errors
Reset BERT Test
None
Loop Far
Unloop Far
NET PLB
NET LLB
NET MLB
DTE MLB
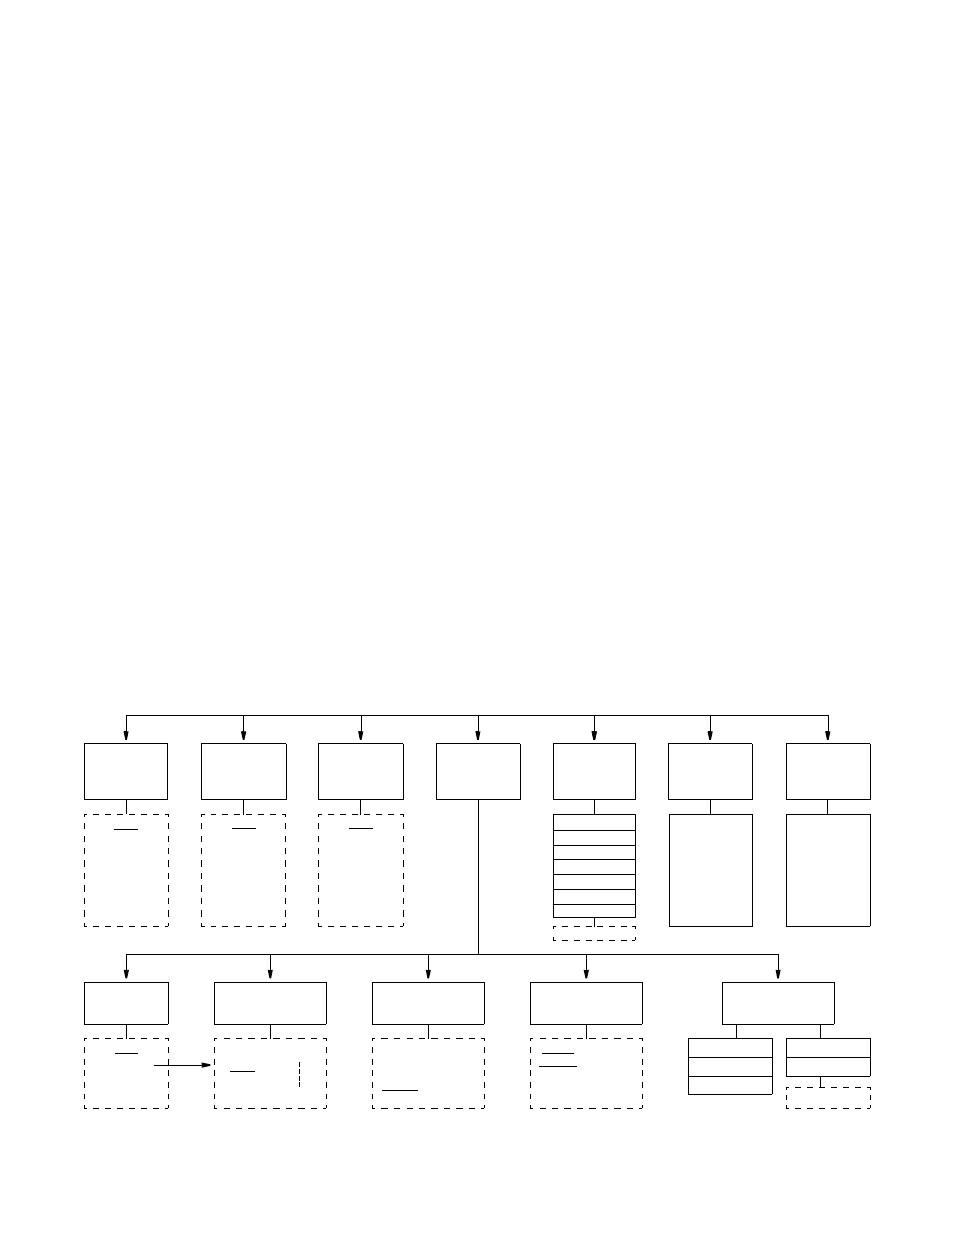
Diagnostics Menu Diagram
ALL
IDLE
BERT
Channel
Channel 1
Channel 24
1 IN 8
3 IN 24
ALT
CLEAR
QRSS
BERT
Pattern
63, 511
2047
2
15
-1
2
20
-1
2
23
-1
Toward
Network
BERT
Direction
Toward
DTE
BERT
Results
Errored Seconds
Pattern Sync Loss
Port 1 – 4