8 creating a chart in excel, Creating a chart in excel – SMA Sunny Data Control V.5.0 User Manual
Page 90
Advertising
Managing Data and Saving Data Locally
SMA Technologie AG
92
SDC-TEN081450
Technical Description
11. 8 Creating a Chart in Excel
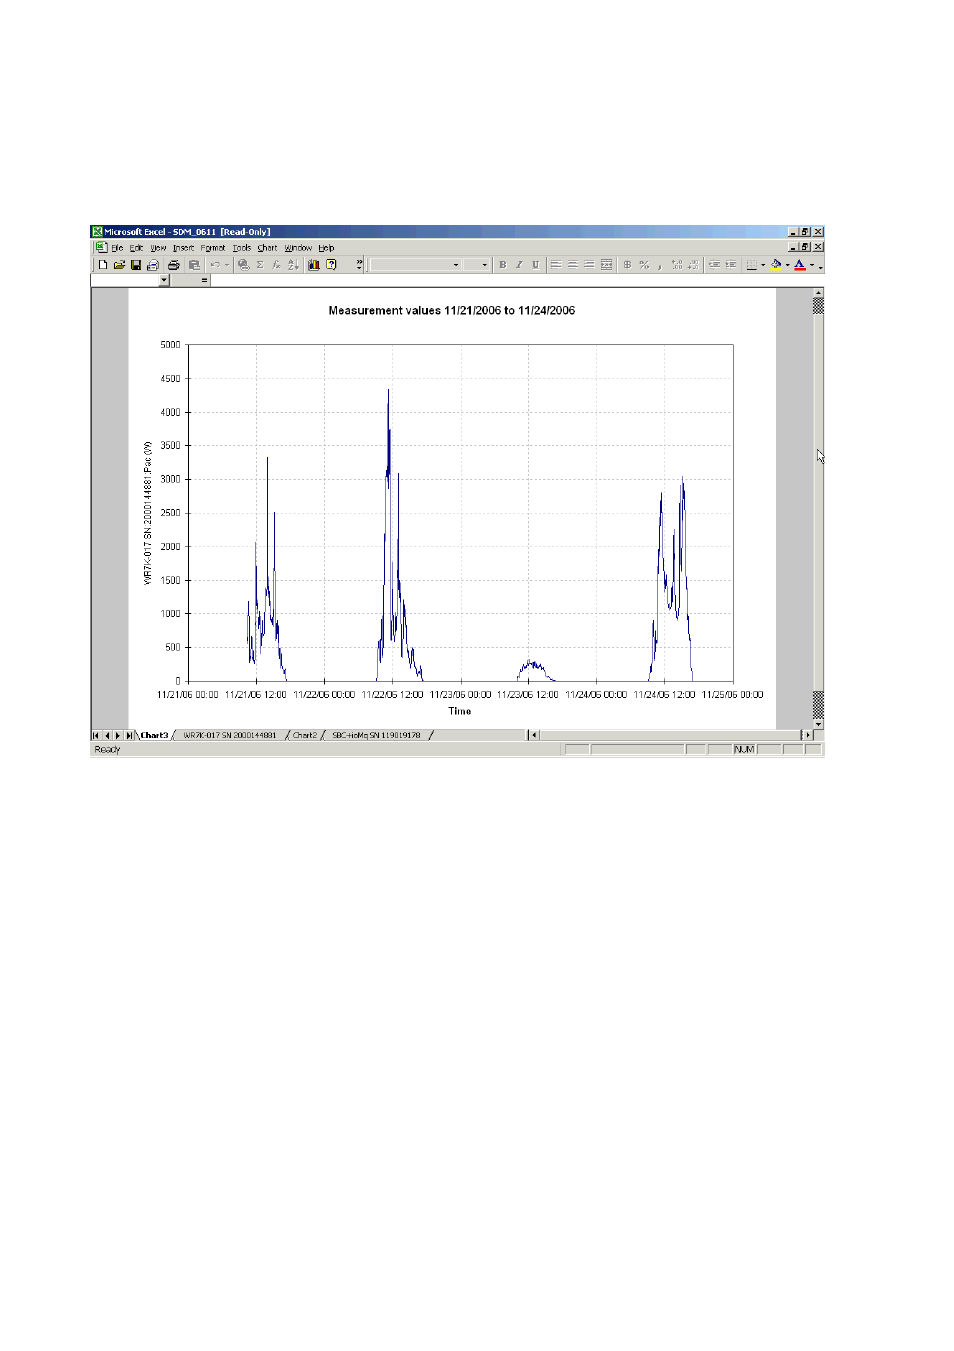
Your recorded measured values can easily be analyzed graphically with Excel. The data is also
automatically visualized in a chart.
To this end, there are two options, which are described in the next sections.
•
Automatic analysis:
The analysis is started via Sunny Data Control. Excel opens automatically with the data
analysis macro.
•
Manual analysis:
Manual analysis is only required if you wish to start the analysis on a PC on which Sunny Data
Control is not installed. The analysis is then started directly from Excel, and the macro is
executed manually.
Advertising