1 displaying data as a graph, 1 selecting the time base, Displaying data – Casella CEL Indoor air quality monitor User Manual
Page 16
Displaying Data
7.
DISPLAYING DATA
Having successfully recorded and transferred data to your computer you are
now in a position to view it.
7.1
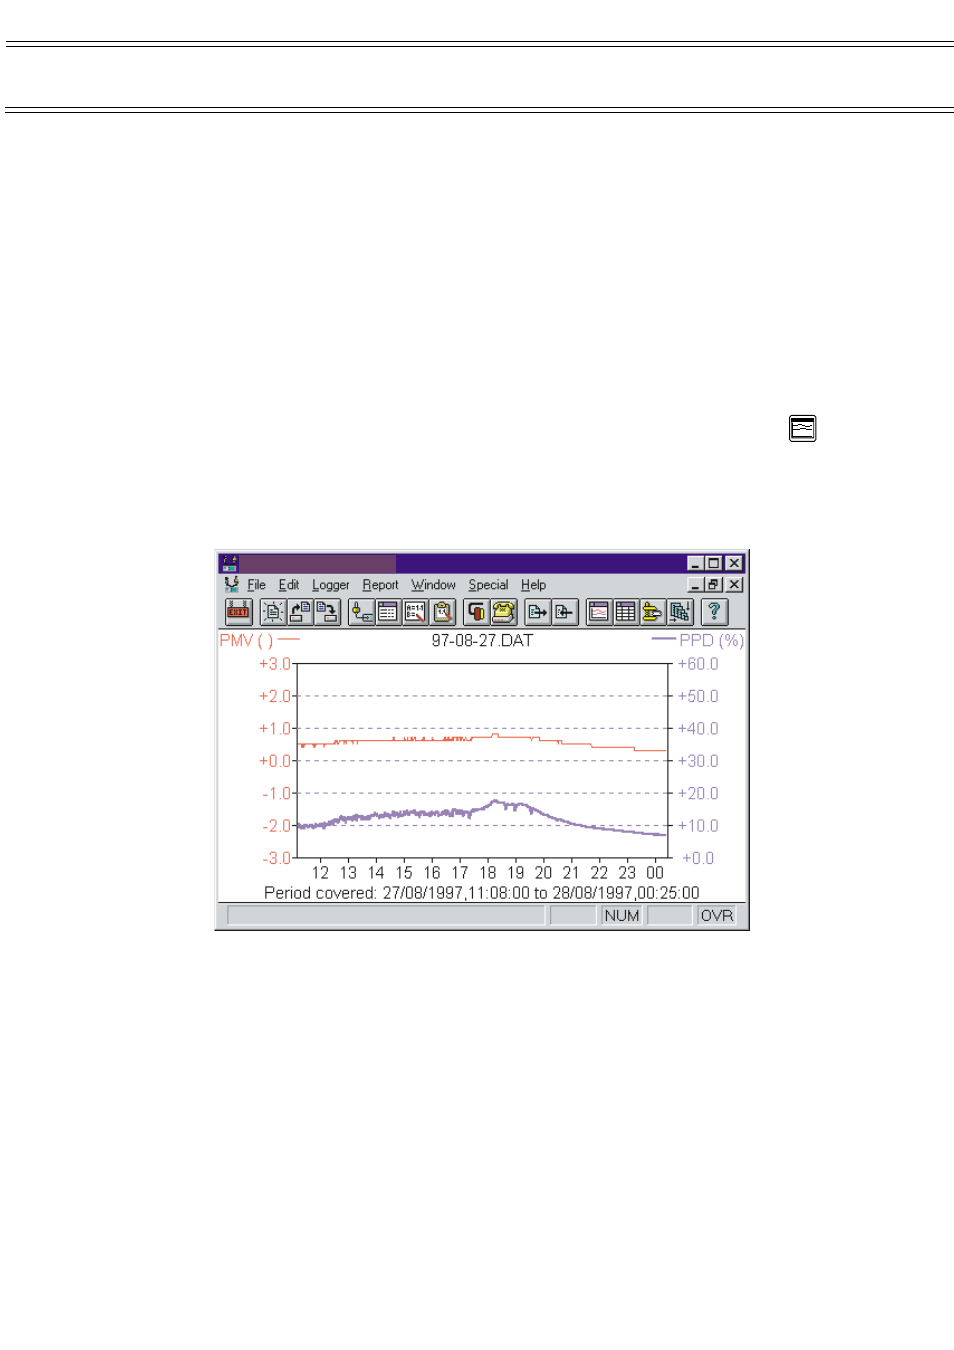
Displaying Data as a Graph
The first method available, is to view data on a dual trace graph. The graph
display forms the basis of all displays available within the Win
I
aq soft
ware.
Both table and summary displays (Sections 7.2 and 7.3) are based on the
information shown by the current graph. This enables the tables and summaries
to be created from a subset of the data contained in any given file (i.e. select a
single days worth of data from a file covering several days).
To display a graph, select Report / Show graph from the menu or click the
icon.
Select the data file from which you want to display the information. The graph
will then be drawn, showing the first 2 parameters contained in the file.
7.1.1 Selecting the Time Base
By default the graph will display the entire time period contained in the data file,
however it is possible to select and display a portion of it instead.
The x-axis will be marked in hours if the total selected period is less than a
single day otherwise it will be marked in days.
To expand the time base proceed as follows.
1.
Click and hold the left mouse button at the point on the x-axis where
you want the new display to start.
2.
Drag the mouse to the right until the displayed cursor lines encompass
the section of the graph you are interested in.
WinIaq
- [Untitled 01]
Page 16 of 42
MICROTHERM indoor air quality &
WinIaq Application Software - User Manual