2 selecting a different trace, 3 changing the vertical scale, Displaying data – Casella CEL Indoor air quality monitor User Manual
Page 17
Displaying Data
3.
Release the left mouse button.
The graph will be redrawn automatically, showing only the portion
selected. This process can be repeated to further expand the display.
4.
To revert back to displaying all the data in the file, click and hold the
left mouse button slightly to the left of the start of the x-axis.
5.
Drag the mouse to the right until the right hand cursor line is slightly to
the right of the end of the x-axis.
6.
Release the left mouse button.
The graph will be redrawn automatically using all the data in the file.
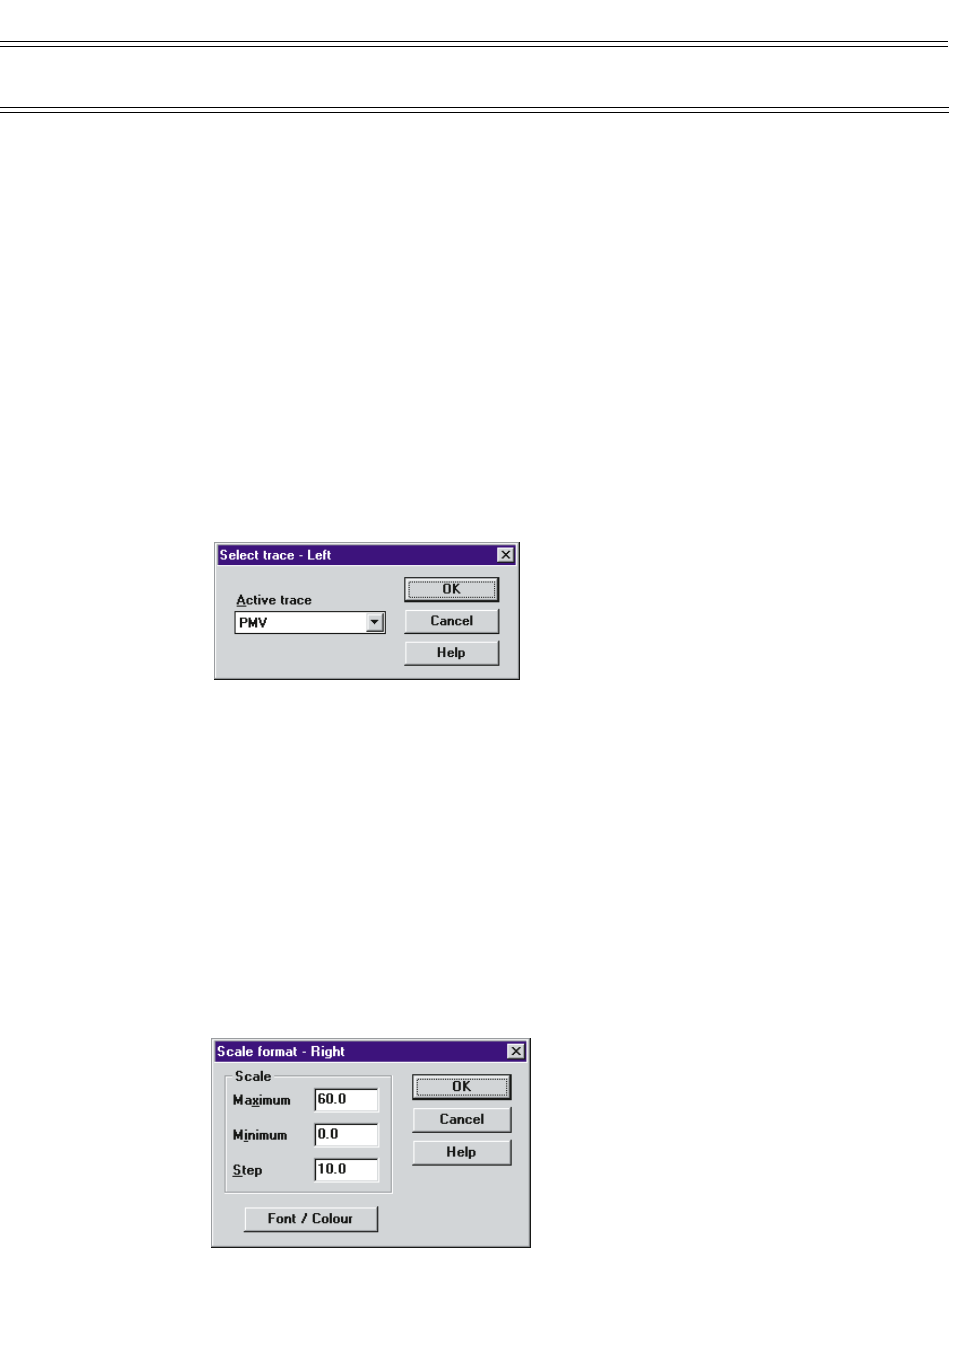
7.1.2 Selecting a Different Trace
The graph can display any two of the parameters available in the currently
selected data file. To change either of the traces to an alternative parameter,
proceed as follows.
1.
Select Report / Left trace… or Report / Right trace… from the
menu.
2.
Select a new trace from the list presented in the dialog box.
3.
Click OK, and the graph will be redrawn using the new selection.
7.1.3 Changing the Vertical Scale
Each trace on the graph can be expanded or offset to present the information
using the best resolution/scale for the data at hand. To alter the scale for a
trace, proceed as follows.
1.
Left trace: Double click to the left of the vertical axis.
2.
Right trace: Double click to the right of the vertical axis.
Page 17 of 42
MICROTHERM indoor air quality &
WinIaq Application Software - User Manual