2 displaying data as a table, 1 table font size, 3 creating a summary – Casella CEL Indoor air quality monitor User Manual
Page 18: Displaying data
Displaying Data
3.
Enter new values for the Maximum, Minimum and Step settings in the
dialog box. The font used to display the vertical scale for the trace
together with the colour used to draw the trace can be modified by
clicking the Font / Colour button.
7.2
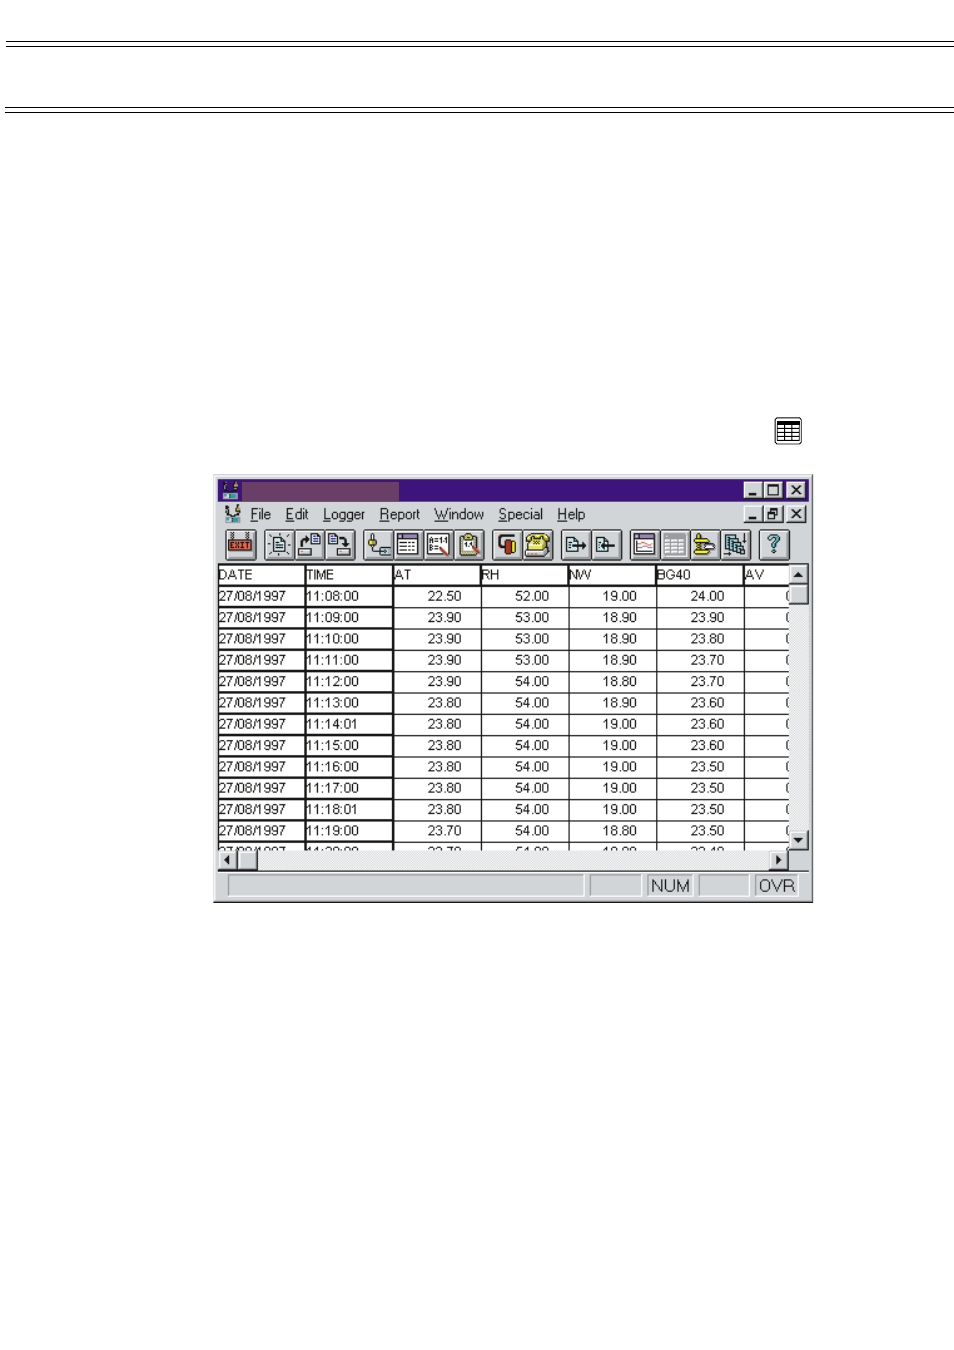
Displaying Data as a Table
Displaying the information in a data file as a table allows you to see the actual
values recorded by the MICROTHERM together with the date & time of their
occurrence.
The table option displays only that portion of the data file currently displayed in
the graph. This allows large data files to be handled more efficiently by
extracting only the period of interest.
To display a table, select Report / Show table from the menu or click the
icon.
You can display other parts of the table by using the vertical and horizontal
scroll bars. When moving vertically the top row (containing the column
headings) will remain visible, likewise when moving horizontally the first two
columns (containing the date & time) will remain visible.
7.2.1 Table Font Size
An additional feature of the table display is the ability to change the font used to
present the information. This can be altered depending on the screen size and
the amount of information to be seen. To alter the font size select Edit / Edit
font… from the menu.
7.3
Creating a Summary
The summary option allows you to easily extract minimum, maximum and
average information from any data file (or part of a file). The summary is built
WinIaq
- [Untitled 01]
Page 18 of 42
MICROTHERM indoor air quality &
WinIaq Application Software - User Manual