Report information, Fig. 6-43 – CIRCUTOR CIRe3 Series User Manual
Page 41
CIR-e
3
Instructions manual
Pag. 41 of 50
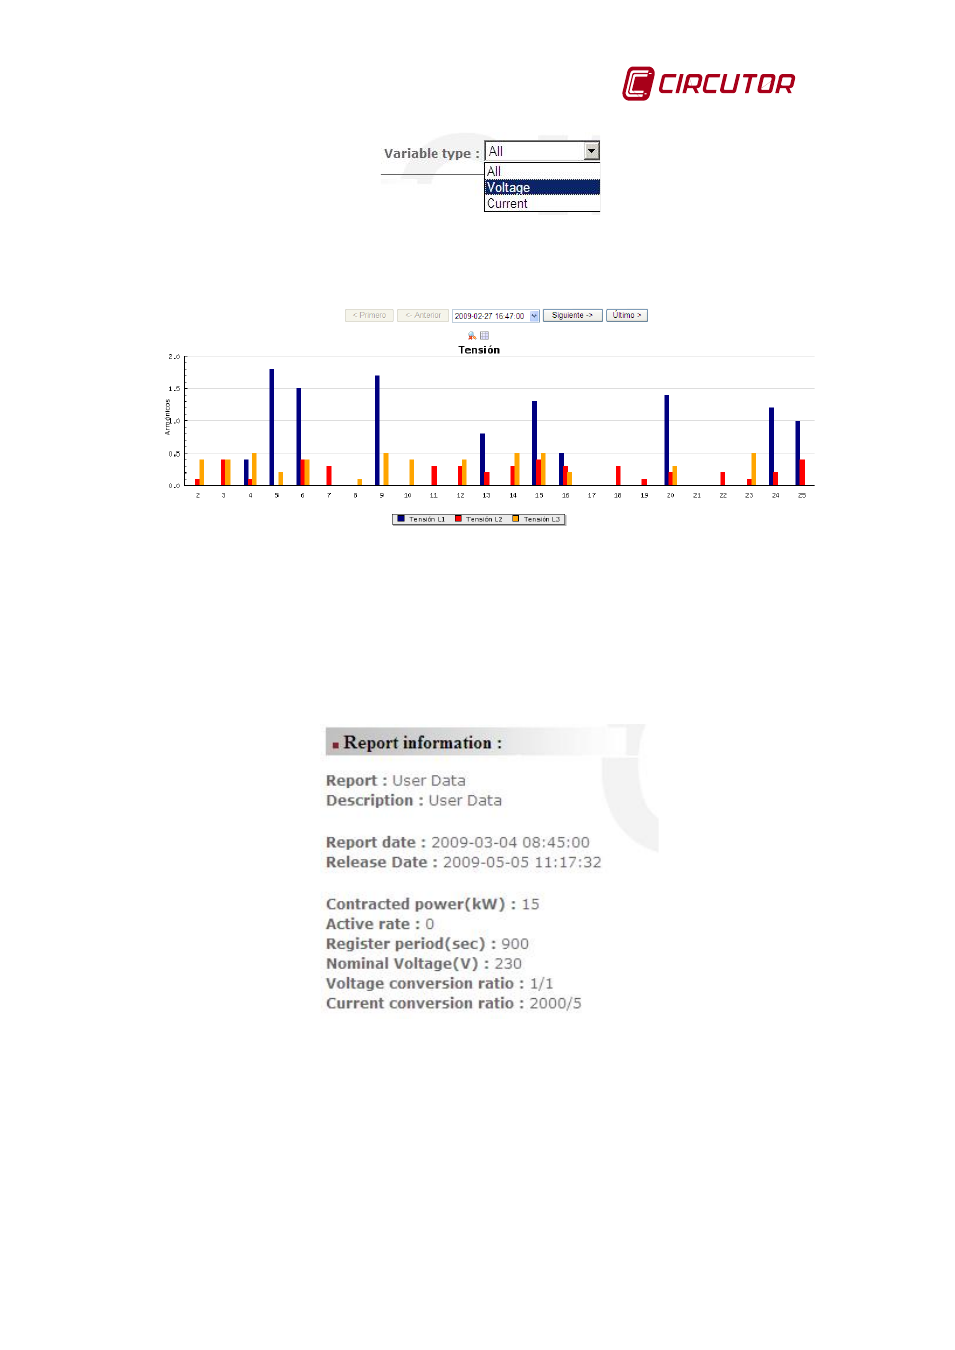
Fig. 6-43.- Menu allowing the selection of harmonics to be displayed
Depending on the choice, the user will get the graphs with more or less detail, As an example
the voltage harmonics are displayed as shown in Fig. 6-44:
Fig. 6-44.- Voltage harmonics
This harmonics graph can then use the Zoom and Table tools. The later shows the harmonics in
a table as it does when using the standard filtering option (see section 6.10.5)
6.10.4 Report information
The screen showing a report shows also all the information related to the configuration of the
CIR-e3 when the measurement was taken and all the parameters concerning probe scale, etc.
(see Fig. 6-37 and Fig. 6-45)
Fig. 6-45.- Report information part
The report gives the following information:
Report and Description: Displays the name of the report and its description, as used in the
configuration process and to send files to the Web application.
Report date: Date when the parameters were recorded in CIR-e³
Release date: Date when the user transferred the data to the CIR-e³ Web page.