CIRCUTOR CIRe3 Series User Manual
Page 43
CIR-e
3
Instructions manual
Pag. 43 of 50
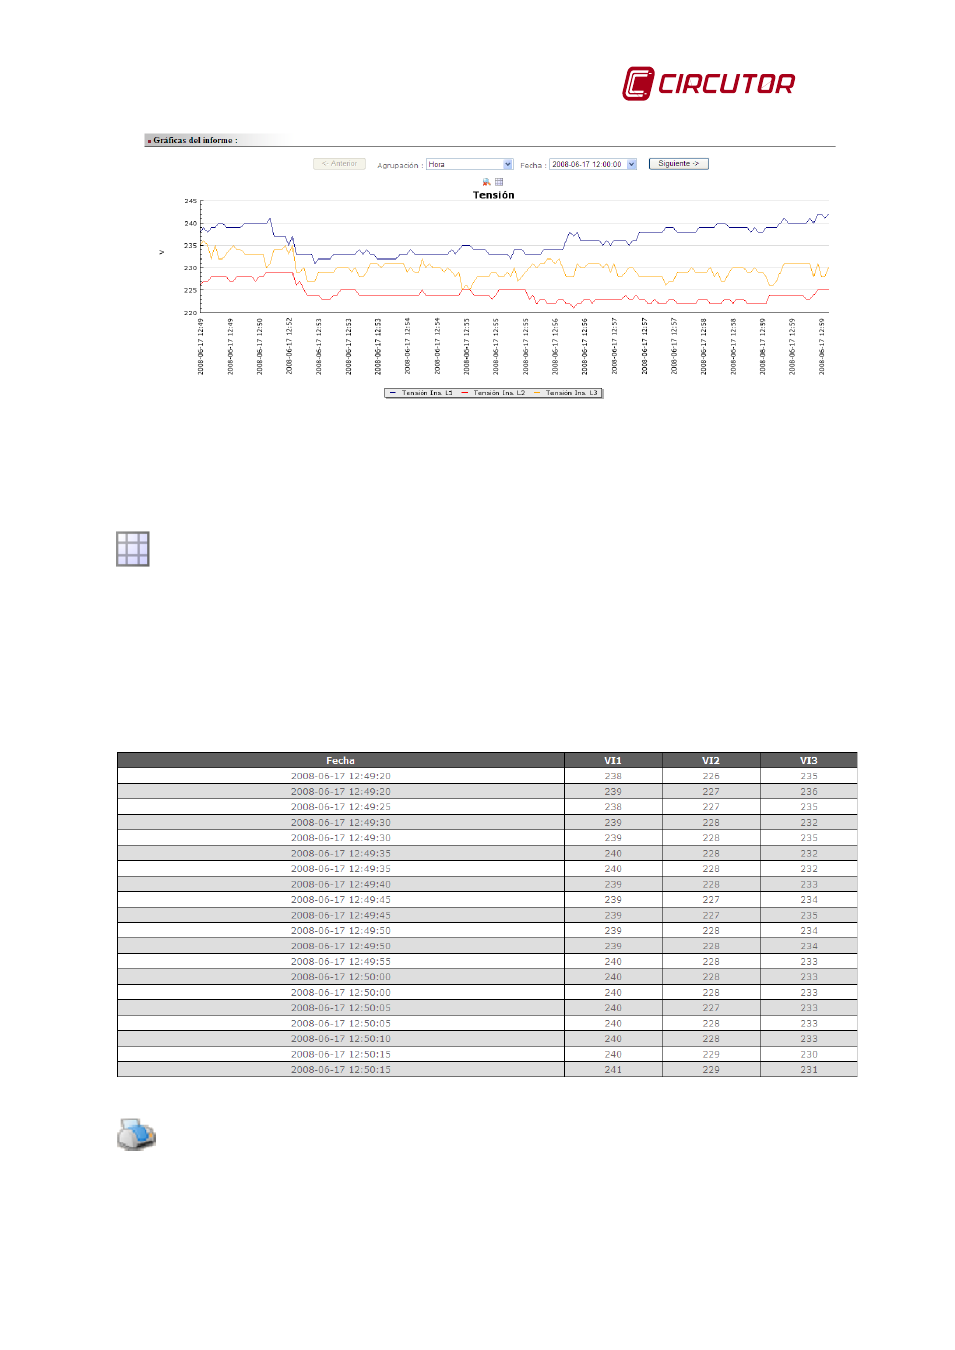
Fig. 6-48.- Graph example after a zoom
To export the displayed images to a different document or format, right-click on the graphic and
select “save image as”. You can save the images of different intervals in a folder and these can
be retrieved later to paste them into a report document in different formats.
Show table:
The “Show table” tool opens a window that shows all the values in the record on a single table.
The Show table tool does not have a grouping menu, as it has the graphic display option.
To export the tables in the Web application to a different document or format, select part or the
whole table and right click on it. It will appear a menu where you can select “Copy” to save the
table temporarily in the Windows clipboard. Open the document where you wish to paste the
table and right click . Select the option “Paste”, to add the table on any part of the document.
Fig. 6-49.- Table format display
Print:
The option “print” implements allows printing the information shown in the screen. Previous to
printing it performs a restructuring of the information displayed in the screen, so that it fits in a
single document. This option includes the header of the report and the selected graphics.