Report graphics: grouping – CIRCUTOR CIRe3 Series User Manual
Page 42
CIR-e
3
Pag 42 of 50
Instructions manual
The remaining information displayed in “Report information” corresponds to the parameters
configured with the CIR-e.exe application during the CIR-e3 setup. The information is related to
the nominal voltage and frequency, contracted power, voltage transformer ratio and current
scale ratio.
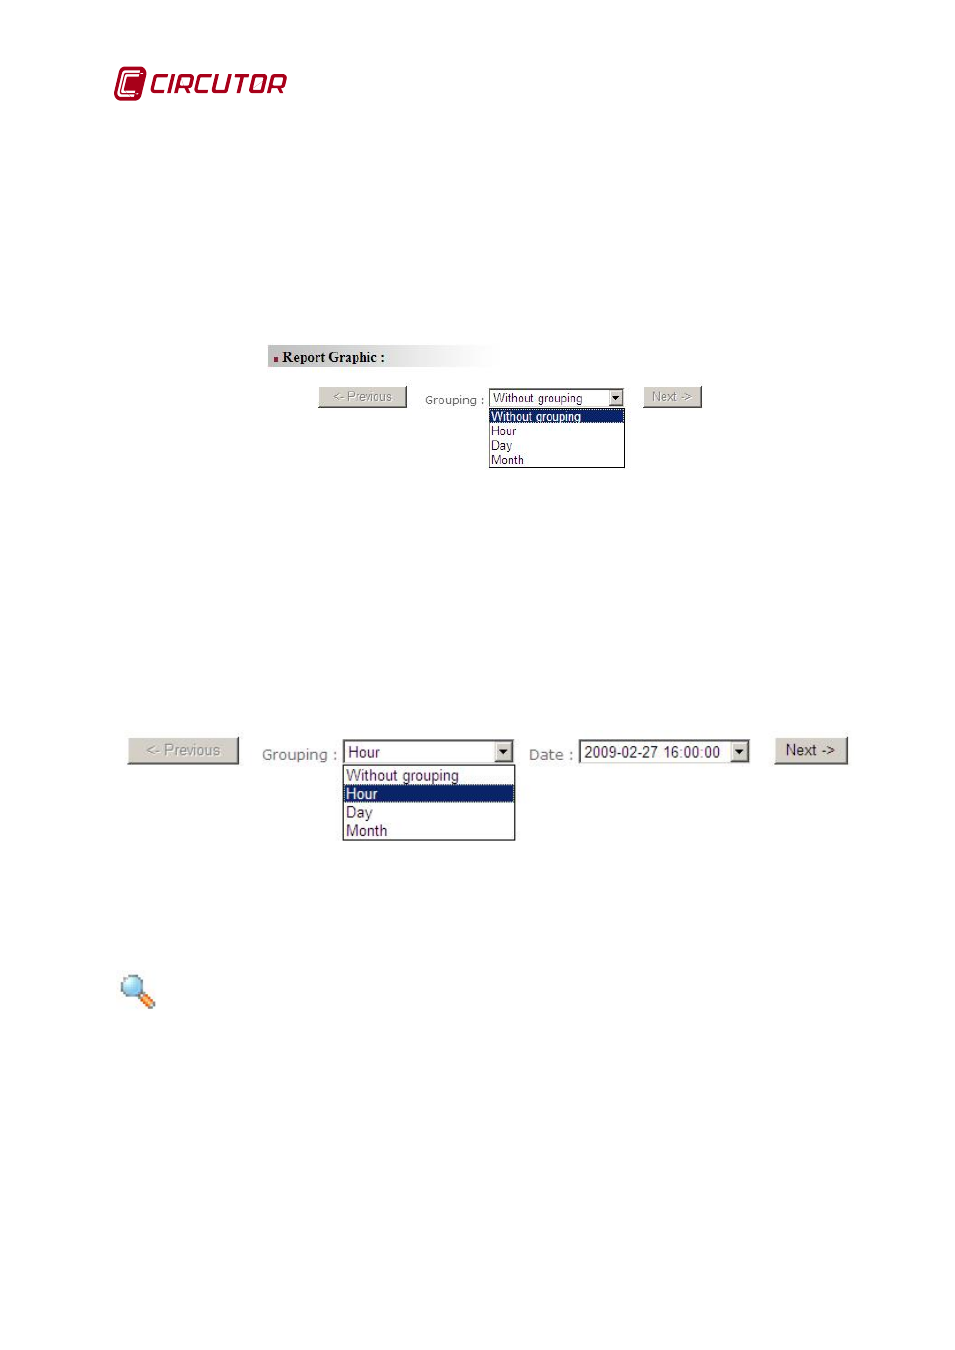
6.10.5 Report graphics: Grouping
Following the "Information report," the website shows graphics of different variables. To
configure the graphics resolution with regard to time, there is a menu allowing the selection of
different data grouping choices (see detail in Fig. 6-47). This allows the selection of time
resolution in the graphs.
Fig. 6-46.- Data grouping choices
Selecting “Not grouped” the Previous / Next buttons are disabled and the graphic shows all the
data in the record time range.
Selecting “Hour”, “Day” or “Month” the user can choose the time resolution. In this case the
menu enables the Previous/Next scroll buttons to jump to the previous “Hour”, “Day” or “Month”
data. In the later case, the application will group all information in the file record in hours, days,
or months. This allows the analysis of shorter periods with higher resolution. Use the Previous /
Next buttons to scroll through the time until you reach the desired interval.
Fig. 6-47.- Example of grouping in hours intervals
At the top part of the graph screens (example Fig. 6-48) there are two icons: a magnifying lens
and a table. These give access to the Zoom and Show Table tools, explained below.
Zoom:
The Zoom tool zooms in or out selected graphs and shows a certain time range in the whole
screen. This tool is useful when you wish to copy the graph and add it to a different document.