Figure 1-2. closing zone (phasor sensing) -4, Figure 1-3. closing zone (average sensing) -4, Cos ) – Basler Electric BE1-25 User Manual
Page 14
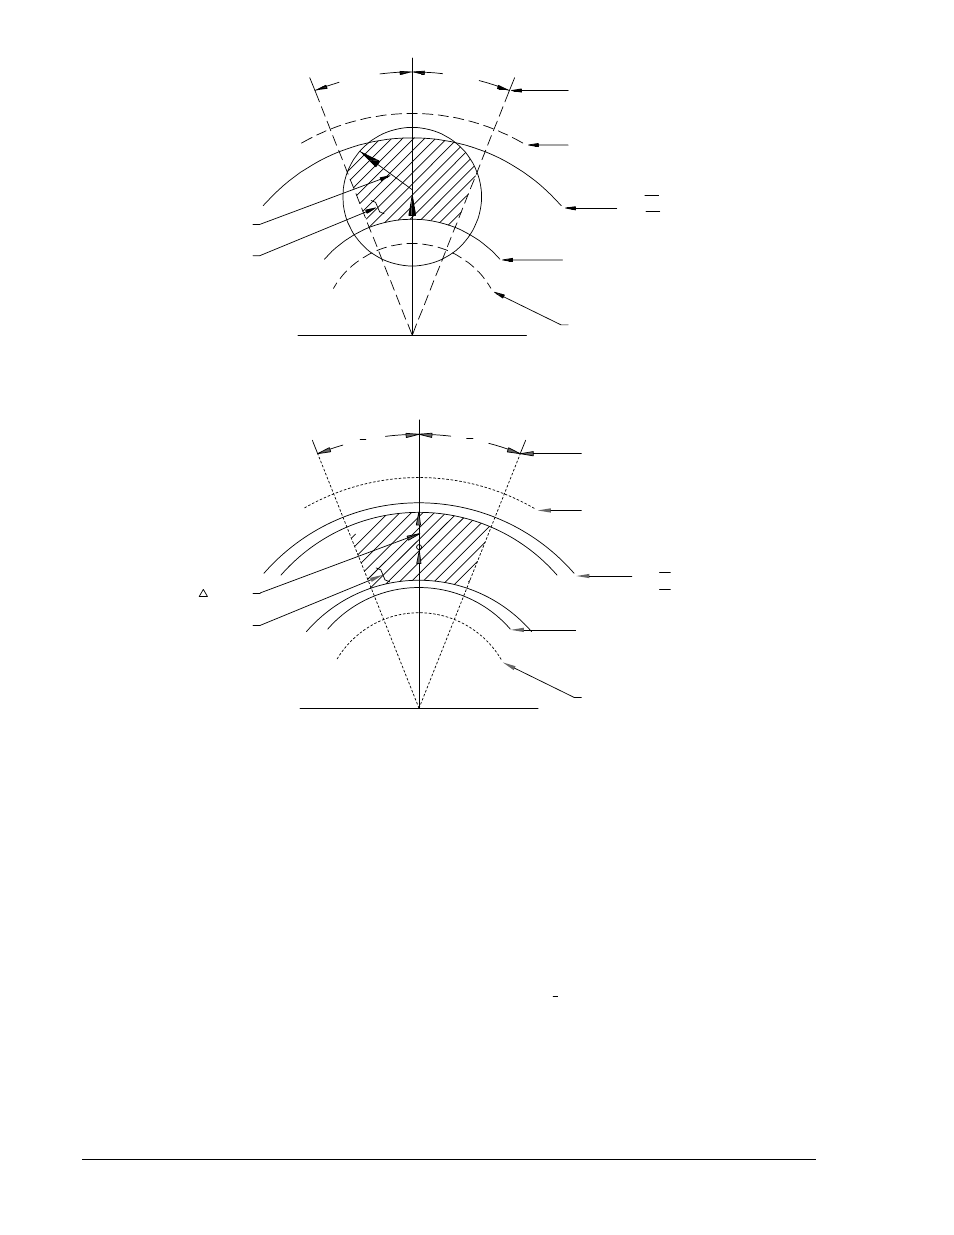
Figure 1-2. Closing Zone (Phasor Sensing)
Figure 1-3. Closing Zone (Average Sensing)
∗
Lines apply only if using the NOT-OV mode setting. When operating in NORMAL mode, the 135V
(MAX) line applies as an upper limit.
Option 2-R, 2-T, or 2-U (Phasor Voltage Difference)
Figure 1-4 may be used as an aid in formulating the voltage difference control settings. Note that the
center reference phasor (
V
B
) represents the monitored bus voltage, while the adjacent phasor (
V
L
)
represents the monitored line voltage. The voltage difference control (∆V) forms an area of acceptance
limit when rotated through 360 degrees. This allows either the voltage difference or the phase angle to be
selected, and the remaining value to be calculated.
Calculate the voltage difference (∆V) using the law of cosines. The equation is:
∆
V
V
V
V V
L
B
L
B
=
+
− ⋅
⋅
⋅
(
cos )
2
2
2
1
2
θ
(1)
When
V
L
is tangent to the voltage difference circle, the ∆V phasor is perpendicular to
V
L
at the phase
angle limit. Accordingly, the voltage difference or the phase angle can be calculated by equations 2 and
3, respectively.
θ
V ADJ
∆
ALLOWABLE
CLOSING ZONE
PHASE ANGLE ADJ
135V (MAX)
DL /OV ADJ (LINE) ٭
DB /OV ADJ (BUS) ٭
LL ADJ (LINE)
LB ADJ (BUS)
60V (APPROX.) FIXED
MINIMUM VOLTAGE
P004-35
θ
PHASE ANGLE ADJ
135V (MAX)
DL/OV ADJ (LINE) ٭
DB/OV ADJ (BUS) ٭
LL ADJ (LINE)
LB ADJ (BUS)
60V (APPROX.) FIXED
MINIMUM VOLTAGE
0
0
V ADJ
ALLOWABLE
CLOSING ZONE
P004-38
1-4
BE1-25 General Information
9170200990 Rev U