Trend values context menu, View statistics – Super Systems XGA Viewer User Manual
Page 35
XGA Viewer Operations Manual
Super Systems Inc.
Page 35 of 46
B)
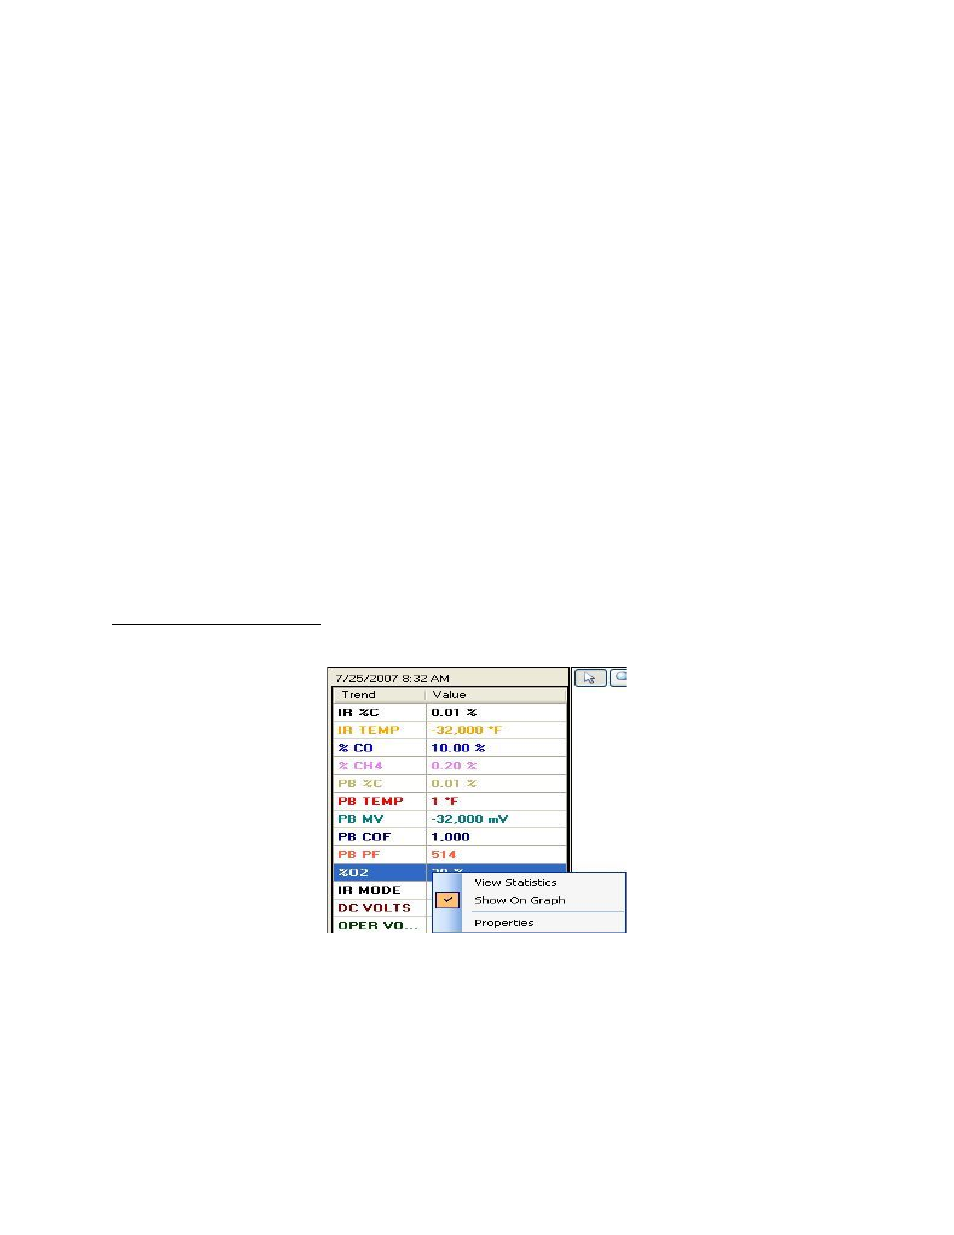
Trend Values – This will display all of the selected trend data points at the specified time
(cursor position).
C)
Test Sessions – These are any test sessions that have been performed on the selected
instrument (PGA only).
D)
Chart Cursor – The chart cursor is the vertical red line on the chart. This is the cursor
that will allow the user to view the trend data points for a specific date/time. Unless
moved by the user, the cursor is located at the left of the chart.
E)
Chart Interval – This is the range for the time period (X-axis) for the chart. The options
for the interval are:
a.
1 Hour
b.
2 Hours
c.
4 Hours
d.
8 Hours
e.
12 Hours
f.
1 Day
g.
2 Days
h.
4 Days
i.
1 Week
F)
Go To Current Date/Time – This will allow the user to display the current date/time’s
data. Clicking on this button once will display the most recent
downloaded
data.
The left and right arrow buttons next to the chart interval will move the chart either backward
or forward by the selected interval, which will allow the user to view previous data logged data
at the selected interval.
Trend Values Context Menu
If the user right-clicks on any of the trend values (Item
B
above), a context menu will be
displayed.
Figure 40 - Trend Values Context Menu
View Statistics
The
View Statistics
menu option will allow the user to view some basic statistics about the
selected trend value.
The
Trend Analysis
screen contains five statistics that can be viewed.