Show on graph, Properties, Graph manipulation buttons – Super Systems XGA Viewer User Manual
Page 36: Cursor button, Show on graph properties
XGA Viewer Operations Manual
Super Systems Inc.
Page 36 of 46
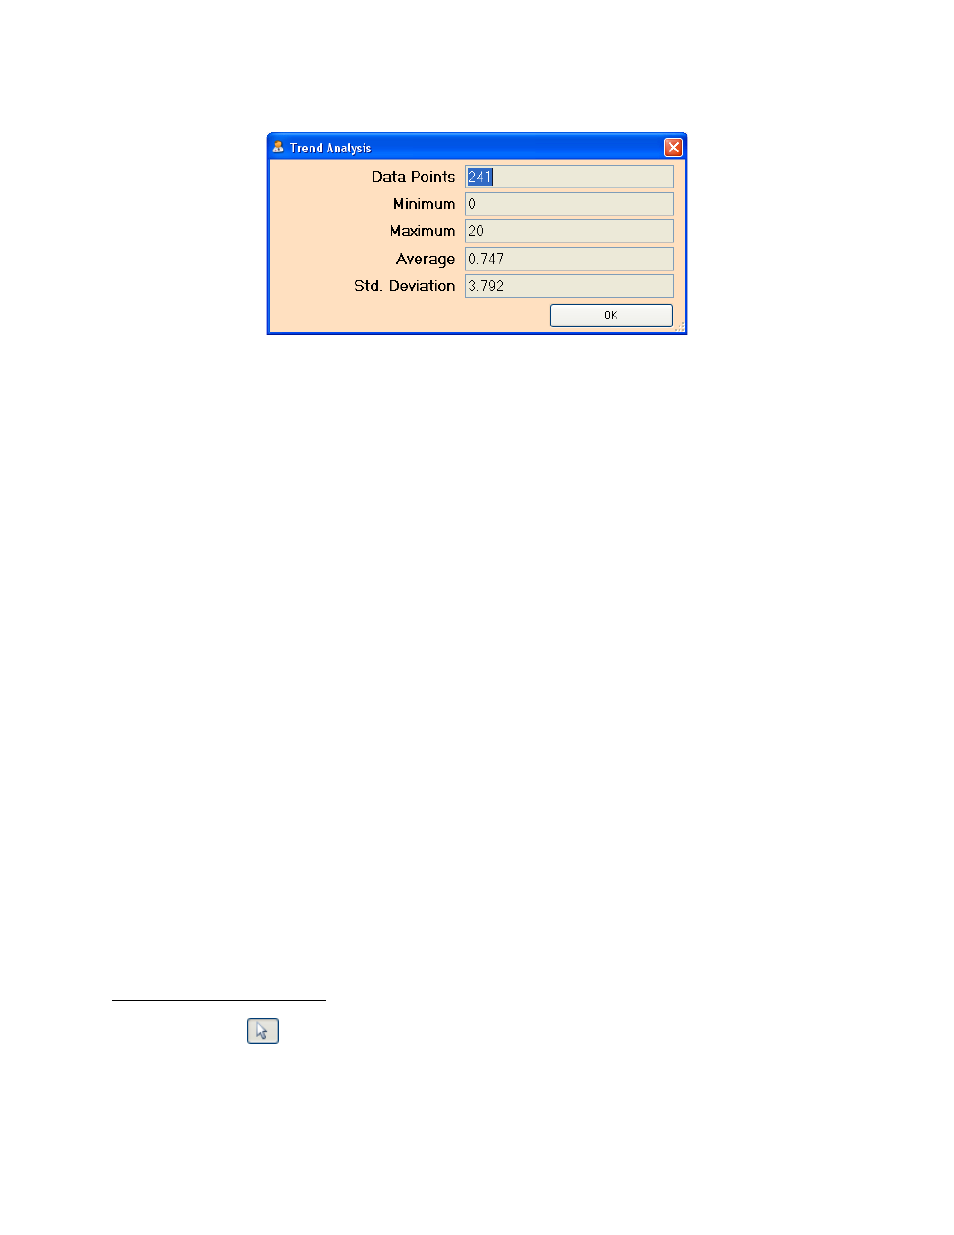
Figure 41 - Trend Analysis window
•
Data Points – This is the number of data logged data points for the specific trend. These
data points are dependent on the chart interval time framed chosen (Item E from above).
For example, if the chart interval is 1 hour, then the number of data points would be 61.
If the chart interval is 4 hours, then the number of data points would be 241.
•
Minimum – This is the lowest value that the specific trend reached within the selected
chart interval time frame.
•
Maximum – This is the highest value that the specific trend reached within the selected
chart interval time frame.
•
Average – This is the average value for the specific trend value within the selected chart
interval time frame. All of the trend’s data points are added up and divided by the
number of data points to determine the average trend value.
•
Std. Deviation – This is the standard deviation for the specific trend value within the
selected chart interval time frame. The standard deviation is a statistical value that
determines how far from the average value each data point value was.
Show On Graph
This option will allow the user to view the specific trend value on the graph, or remove the trend
value from the graph. If the trend value is viewed on the graph, there will be a check mark next
to the
Show On Graph
menu option. If the trend value is not viewed on the graph, there will not
be a check mark next to the
Show On Graph
menu option.
Note: If the trend value is not viewed
on the graph, that trend’s values will still be displayed on the left of the screen (Item B from
above)
.
Properties
This option will allow the user to modify the specific trend’s properties, such as the formatting,
or the name. This menu option will actually just display the
Edit Trend
section above) for the specific trend. Clicking on the
Properties
menu option is the same as
clicking on the Properties button from the
Edit Template
screen (Instrument Menu Button
section above).
Graph Manipulation Buttons
Cursor Button -
The cursor button will display the arrow cursor on the graph. This acts as the default setting for
the graph and does not manipulate or change the graph in any way, but it will allow the user to
move the graph’s cursor.