Thd meter, 53 3.69. bit layout in bit scope, 53 3.70. thd meter – Metric Halo SpectraFoo User Manual
Page 53
Instruments
53
1
2
3
4
5
6
7
8
Column #
64
Samples
per
Column
Figure 3.68: Bit Scope Layout with 512 Sample Time Slice and 8 Columns
Each time the display is updated, all of the samples in the time slice are shown. The number of samples in the
time slice are determined by the I/O hardware’s buffer size.
The samples are displayed starting with the first sample in the time-slice in the upper left hand corner of the
instrument. Each successive sample is place under the previous one until the bottom of the column is reached.
The next sample is placed at the top of the next column. So, in the figure below the samples 1 – 64 are in
column 1; 65 – 128 are in column 2; and so on with samples 449 – 512 in column 8. The layout of the bits
in each sample are shown below:
Sample #
1
2
3
4
.
.
.
Bit # 1 2 3 4 5 6 7 8 9 10 11 12 13 14 15 16 17 18 19 20 21 22 23 24
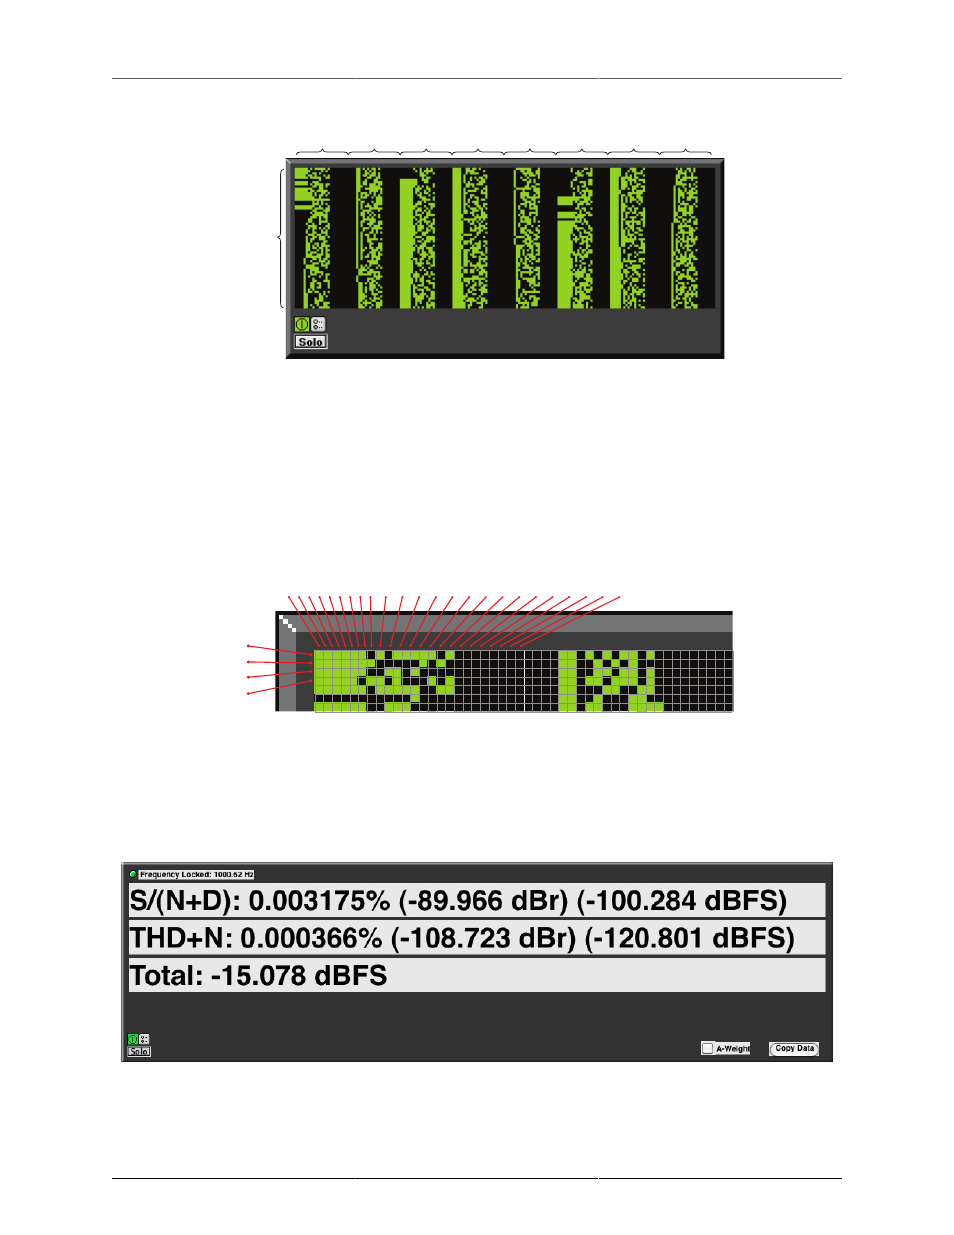
Figure 3.69: Bit Layout in Bit Scope
THD Meter
The THD Meter is used to measure the noise and distortion performance of audio equipment.
Figure 3.70: THD Meter
To select the audio channel to analyze, hold the control key and click the parameter control button.