Coherence expressed mathematically, 68 4.24. simple source and response signals, 68 4.25. simple source – complex response signal – Metric Halo SpectraFoo User Manual
Page 68
The Transfer Function
68
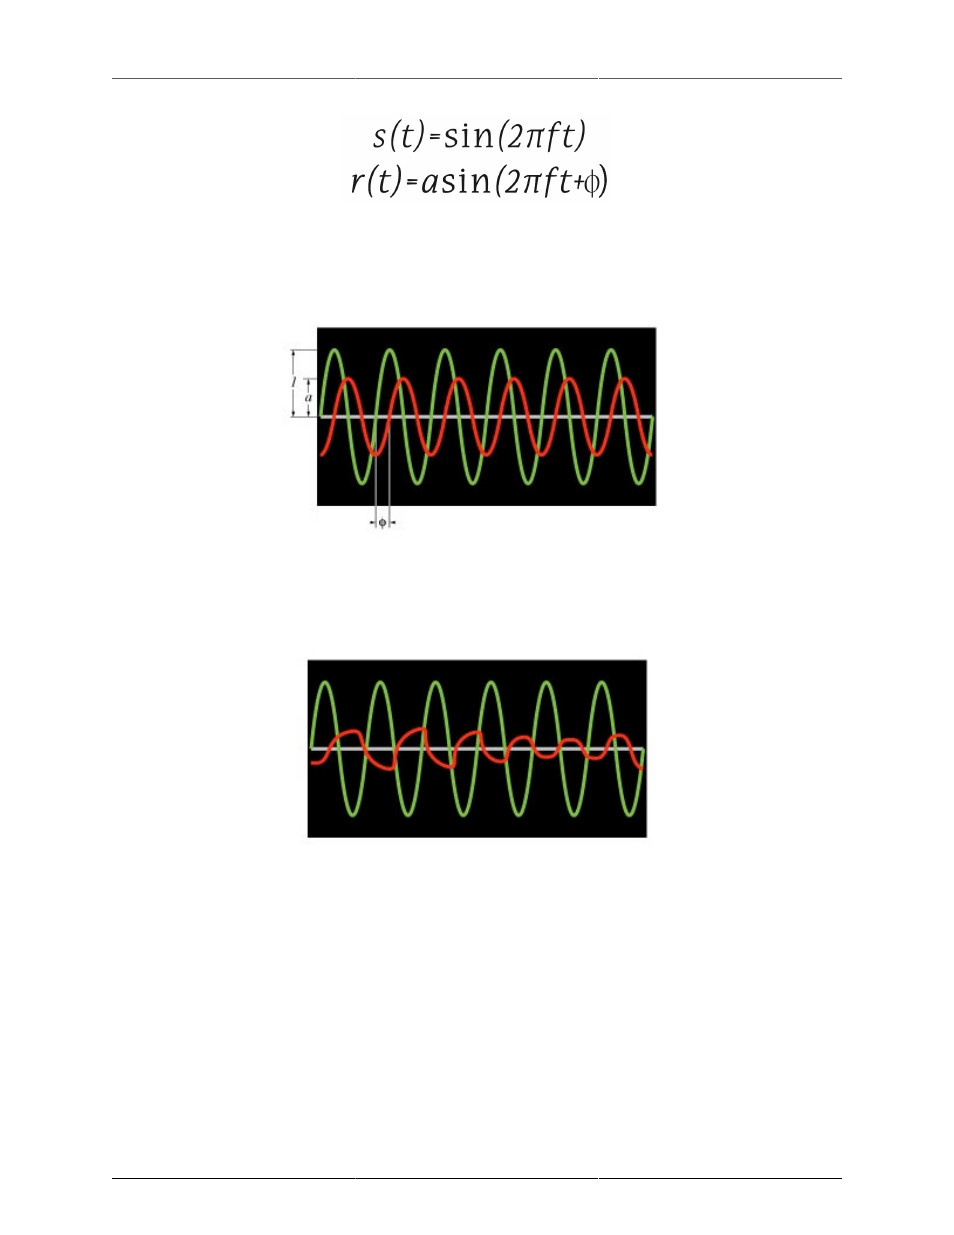
Figure 4.23: Coherence expressed mathematically
The source signal s(t) is a sine wave with unit amplitude and frequency f. The response signal r(t) is a phase-
shifted sine wave with amplitude a and frequency f. These two signals are shown below (the source signal is
green and the response signal is red):
Figure 4.24: Simple source and response signals
Even though there is a phase shift between the source and response, the phase shift is constant in time. On
average the signals line up the same way all the time. On the other hand, if the signals are not related to
each other:
Figure 4.25: Simple source – Complex response signal
In this case, the phase shift between the source and response signals changes over time. This means that on
average the signals do not line up with each other. The coherence will be close to zero.
If the SUT is stationary (e.g. it is linear, does not change over time, and passes at least a portion of the source
signal) the coherence will be “1” for all frequencies. This is what we expect when we make a time aligned
measurement on an electronic system (like an EQ).
If the SUT is non-stationary or if the SUT does not pass any of the source signal in a particular frequency band,
then the coherence in that band will be “0”. Unless we are having big problems, the frequency bands for which
the coherence is small or “0” should be limited, even with acoustic tests. If the coherence is “0” or near “0” for
most of the audio bandwidth, this indicates that the SUT is either not properly connected, the measurement
has not been time-delay compensated with the delay finder, or that the SUT is sufficiently nonlinear that it is
not possible to analyze it with the transfer function (a distortion generator is an example of such a device).