Transfer function controls window – Metric Halo SpectraFoo User Manual
Page 59
The Transfer Function
59
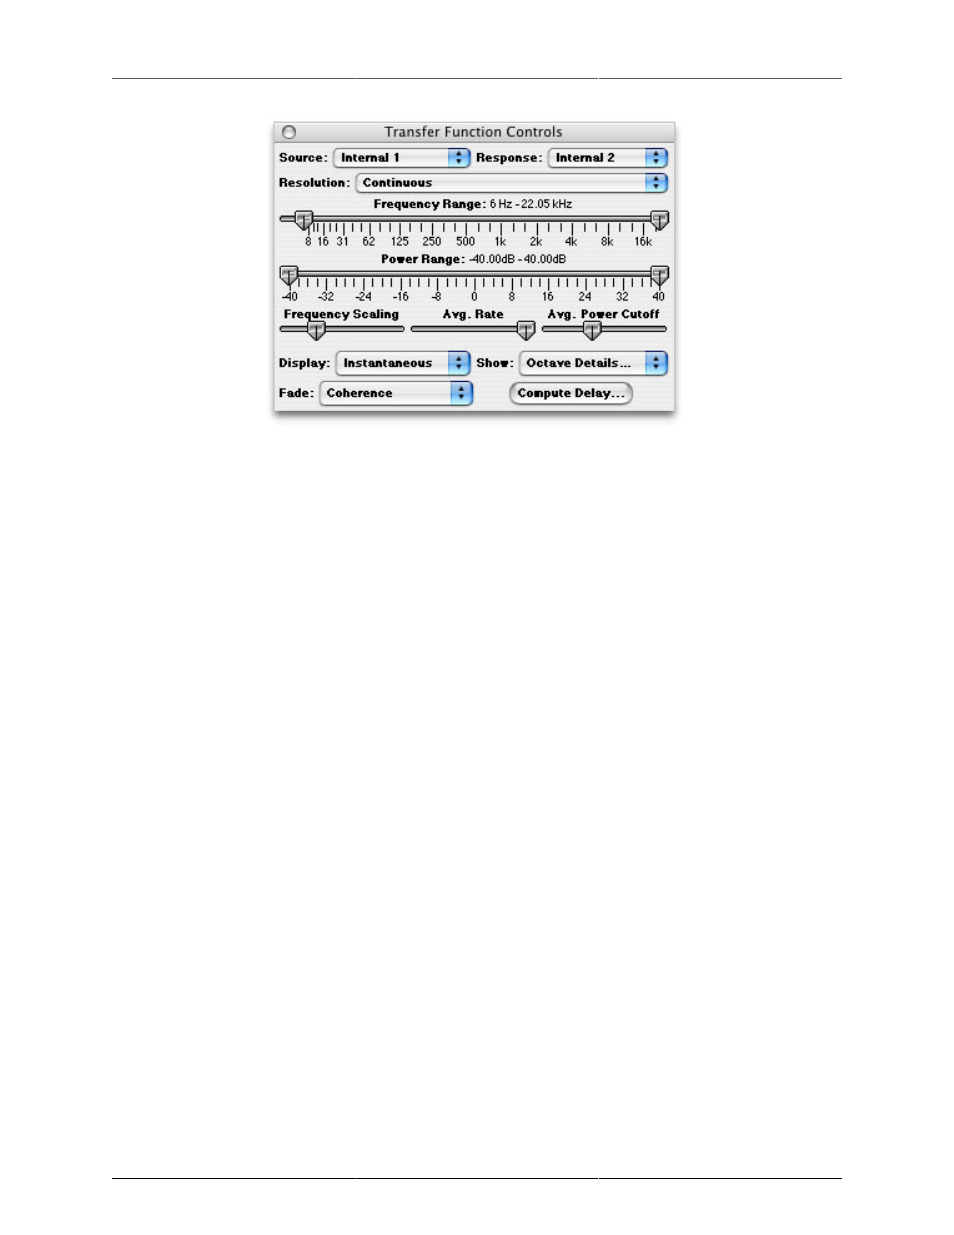
Figure 4.5: Transfer Function Controls window
Source pop-up menu: You use this menu to select the source channel.
Response pop-up menu: You use this menu to select the response channel.
Resolution pop-up menu: You use this menu to select the octave resolution of the analysis. You can select from:
1. 1 Octave: power is displayed as bars; each band is one octave wide.
2. 1/2 Octave: power is displayed as bars; each band is one half of an octave wide.
3. 1/3 Octave: power is displayed as bars; each band is one third of an octave wide.
4. 1/6 Octave: power is displayed as bars; each band is one sixth of an octave wide.
5. 1/12 Octave: power is displayed as bars; each band is one twelfth of an octave wide.
6. 1/24 Octave: power is displayed as bars; each band is one twenty-fourth of an octave wide.
7. Continuous: power is displayed as a continuous curve.
Frequency Range Slider – You use this range slider to control the visible bandwidth of the transfer function.
Power Range Slider – You use this range slider to control the visible power range of the transfer function. The
power scale is automatically scaled to keep the display logarithmic.
Frequency Scaling Slider – You use this slider to control the scaling of the frequency axis of the transfer function.
Avg. Rate Slider – You use this slider to control the averaging rate of the transfer function analysis. The far
left end of the slider is “No averaging” and the far right end of the slider corresponds to averaging over 2
minutes (approximately). The averaging done by the transfer function is a decaying exponential average, so
it is difficult to assign a numerical value to the averaging rate. For some measurements (e.g. ones with very
little noise, like measuring an EQ) you can use faster averaging rate (closer to the left hand side of the slider);
that makes the measurement much more responsive. For very noisy acoustic environments you need a slower
averaging rate (closer to the right hand side of the slider), so that you average over more time. For most acoustic
environments, the middle of the slider is a good starting point, but you will need to adjust this parameter on
a case-by-case basis.
Avg. Power Cutoff Slider – You use this slider to control threshold level applied to the spectrum of the source
signal. When the source signal level is higher than the threshold (this is computed for every spectral line in
the spectrum) the transfer function adds the measurement to the average. If the level is below the threshold,
the data is ignored. You can see which bands are above the threshold level by setting the Fade pop-up menu
to Age. For every band that is above threshold, the response curves will be drawn in bright green. For normal