MOTU UltraLite-mk3 - Hybrid FireWire/USB 2.0 Audio & MIDI Interface User Manual
Page 74
C U E M I X F X
74
Adjusting filters in the display
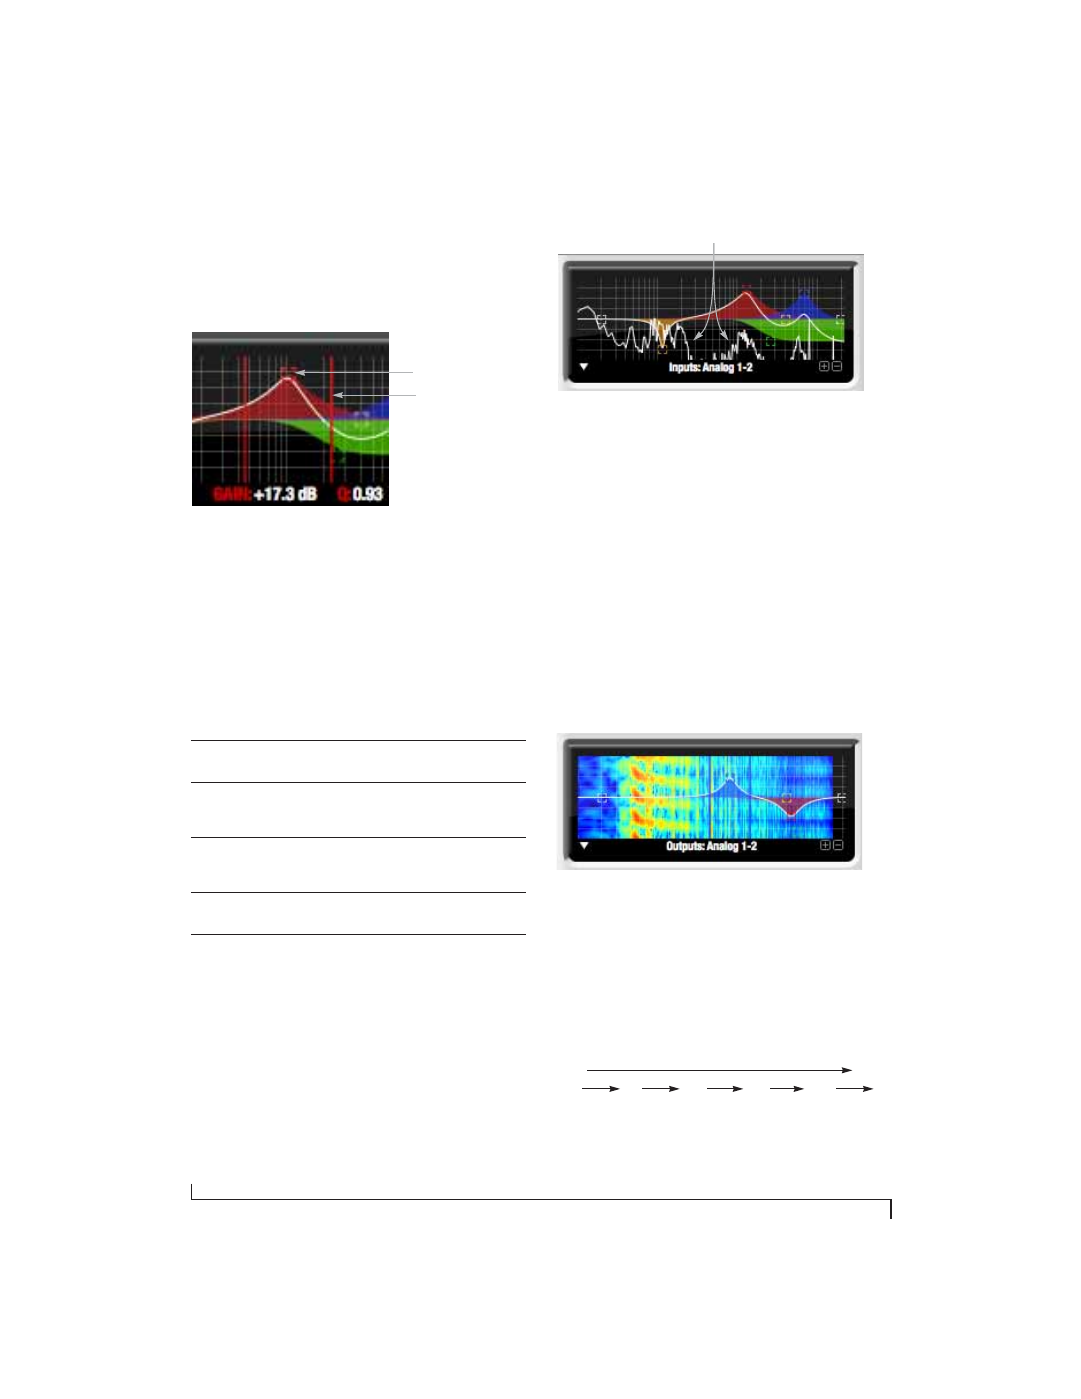
Each filter has a handle, displayed as shown below
in Figure 10-12 (in the filter’s color), for adjusting
its boost/cut and/or frequency:
Figure 10-12: Drag the filter handle to adjust its frequency and/or
boost/cut. Drag the Filter Q handles to adjust the Q.
For the EQ filters, when you click the handle, you’ll
also see lines on either side for adjusting the Q
parameter, as shown above.
Filter display options
The
Filter display options
menu
(Figure 10-10)
provides several options for the EQ filter display:
FFT display
Choose
Show FFT
from the
Filter display options
menu (Figure 10-10) to superimpose a real-time
Fast Fourier Transform (FFT) frequency
measurement curve over the EQ filter display, as
demonstrated in Figure 10-13:
Figure 10-13: FFT display.
The FFT curve is post-filter. Therefore, the FFT
shows the results of the EQ filter(s) being applied.
Use the global EQ button for the input or output
channel (Figure 10-3 and Figure 10-6,
respectively) to toggle between the EQ’d and non-
EQ’d FFT display.
Spectrogram
Choose
Show Spectrogram
from the
Filter display
options
menu (Figure 10-10) to superimpose a
real-time spectrogram “waterfall” display in the
background of the EQ filter display, as
demonstrated in Figure 10-14:
Figure 10-14: FFT display.
The spectrogram scrolls from top to bottom, where
the top edge of the display represents what you are
hearing “now”. Color represents amplitude along
the left/right frequency spectrum. The amplitude
color scale runs from black (silence) to red (full
scale) as follows:
Figure 10-15: Spectrogram color-to-amplitude spectrum.
Menu option
What it does
Show no analysis
Turns off both the FFT and
Spectrogram in the Filter display.
Show FFT
Shows/hides a real time FFT analysis
of the current signal being EQ’d,
post EQ filter.
Show Spectrogram
Shows/hides a real-time spectro-
gram “waterfall” in the background
of the filter display, post EQ filter.
Show Band Response
Shows/hides the colored area below
EQ filter points.
Show/Hide Full Window
Analysis
Shows/hides the enlarged filter dis-
play in the CueMix FX window.
Filter Q
(red line)
Filter handle
FFT curve
Black
Blue
Green
Yellow
Orange
Red
Silence
Full scale