Spectragraph analyzer, Spectragraph display, Spectrafoo™ spectrum analysis – Metric Halo Production Bundle User Manual
Page 73
Operation
73
The dynamic transfer function is a combination of a visual representation of how the plug-in is processing the
signal and an intuitive controller for the crossover filter bands.
The horizontal axis provides frequency calibration in Hertz (Hz), while the vertical axis provides level cali-
bration in decibels (dBr). The heavy white line indicates the relative change in level at each frequency that
is created by the combined effects of all of the active bands in the plug-in. Each crossover point (low to mid
and mid to high) is represented by a colored dot in the transfer function. You may drag the dots to adjust the
crossover points.
If you right-click (Mac/Win) or Mac
⌃ (Control) click on the transfer function, you will see a menu to set the
vertical dB scale for the display. The values are:
• ±3 dB
• ±6 dB
• ±12 dB
• ±24 dB
• ±36 dB
Spectragraph Analyzer
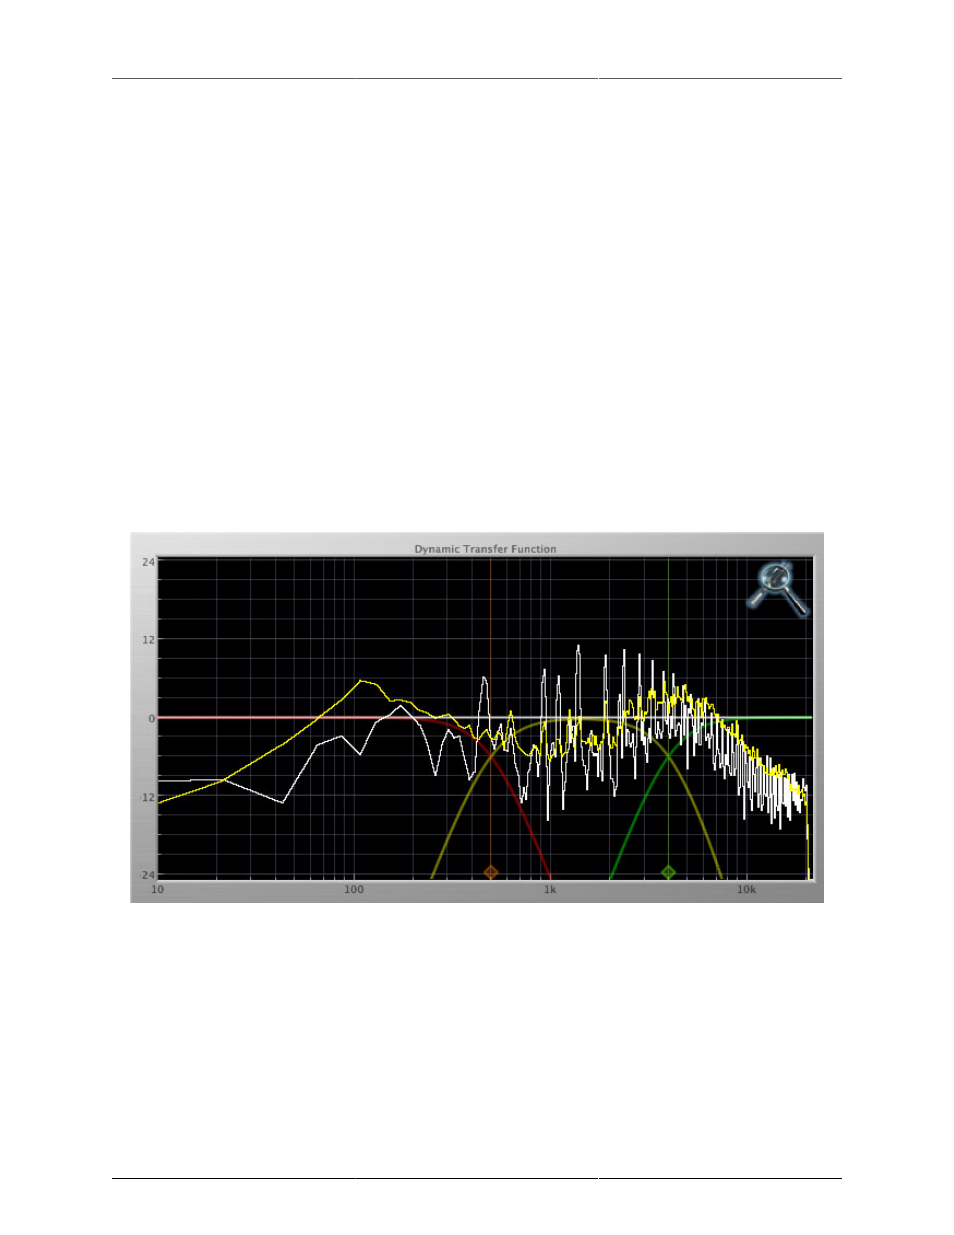
Clicking the SpectraFoo™ logo in the upper right hand corner of the transfer function will activate the spec-
tragraph, showing the realtime frequency analysis of your signal:
Figure 14.13: Spectragraph Display
The traces are:
• White: Left channel instantaneous display
• Red: Right channel instantaneous display
• Yellow: Left channel average display
• Blue: Right channel average display
The instantaneous trace updates in real-time, allowing you to see the immediate peak level of your audio. The
average trace displays the level as averaged over a short period, giving you a more general view.