Tooltip control, Graphs disclosure control, Gain reduction meter – Metric Halo Production Bundle User Manual
Page 86: 86 graphs disclosure control, 86 gain reduction meter, 86 17.9. graph disclosure button, 86 17.10. gain reduction meter, Disclosable graphic displays
Operation
86
Tooltip Control
Figure 17.8: Tooltip Control
This button toggles the tooltip display. When enabled, tooltips wil be shown when the mouse hovers over a
control. When the tooltip display is disabled, you may still see tooltips by holding down the
? key and hovering
over a control.
Graphs Disclosure Control
Figure 17.9: Graph Disclosure Button
The Graphs disclosure control allows you to show and hide Multiband Expander’ display graphs. This allows
you to maximize screen real-estate while still providing details on the processing when they are needed. Click
on this control to toggle the visibility of the graphs. Multiband Expander will automatically make the plug-in
window smaller when you hide the graphs.
Multiband Expander also uses a number of standard visual representations to give you feedback about what
is happening within the processor. These elements are:
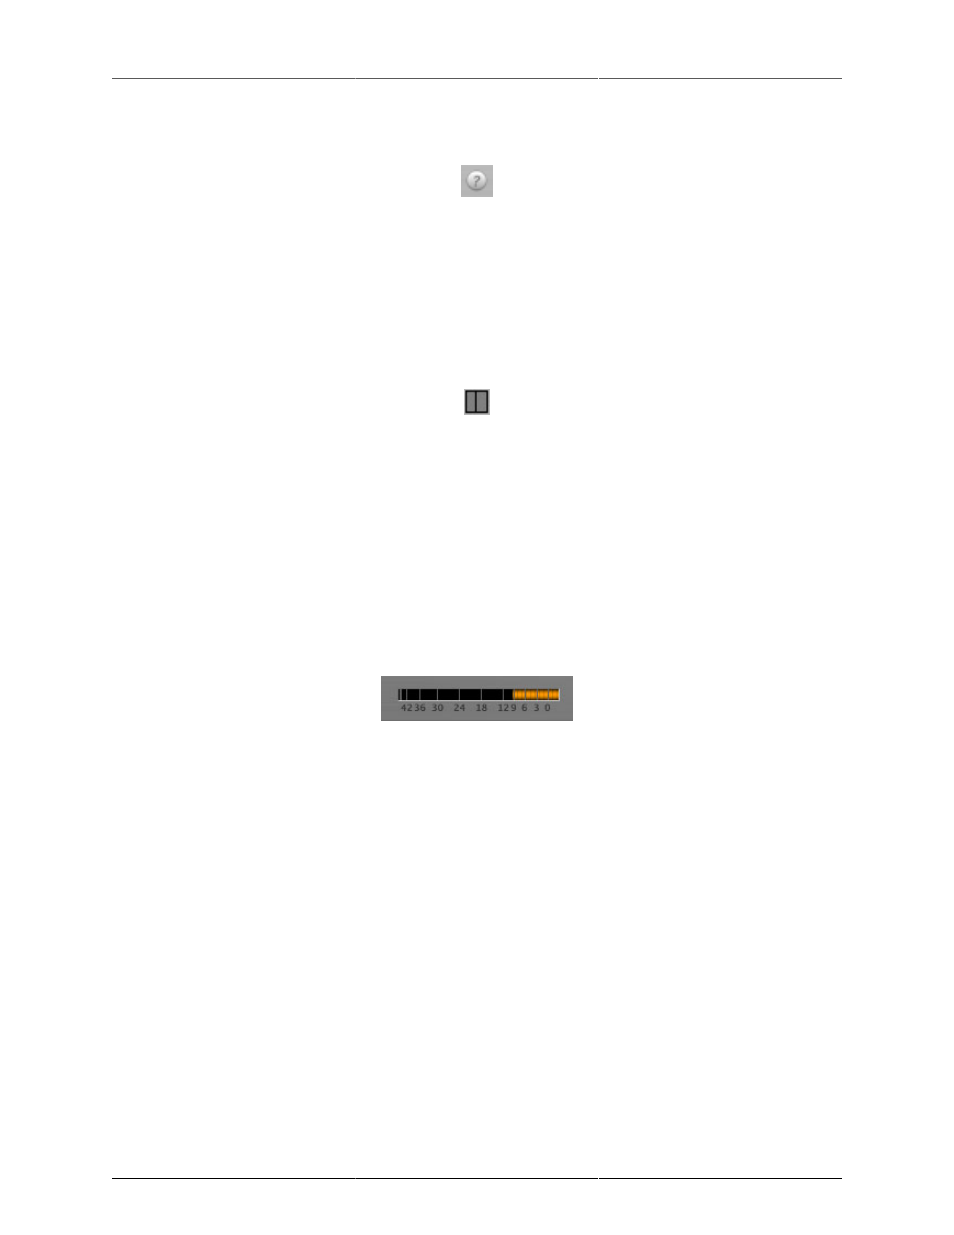
Gain Reduction Meter
Figure 17.10: Gain Reduction Meter
The gain reduction meter, which has an orange bar and grows down from 0 dB, shows the amount of attenua-
tion being applied by its associated dynamics processor at any given time. If you right-click (Mac/Win) or Mac
⌃ (Control) click on the meter, you may set the scale of the gain reduction meter to any of the following values:
• 54 dB
• 24 db
• 12 db
• 6 db
• 3 db