CIRCUTOR CDP-0 User Manual
Page 64
Advertising
CDP
64
Instruction Manual
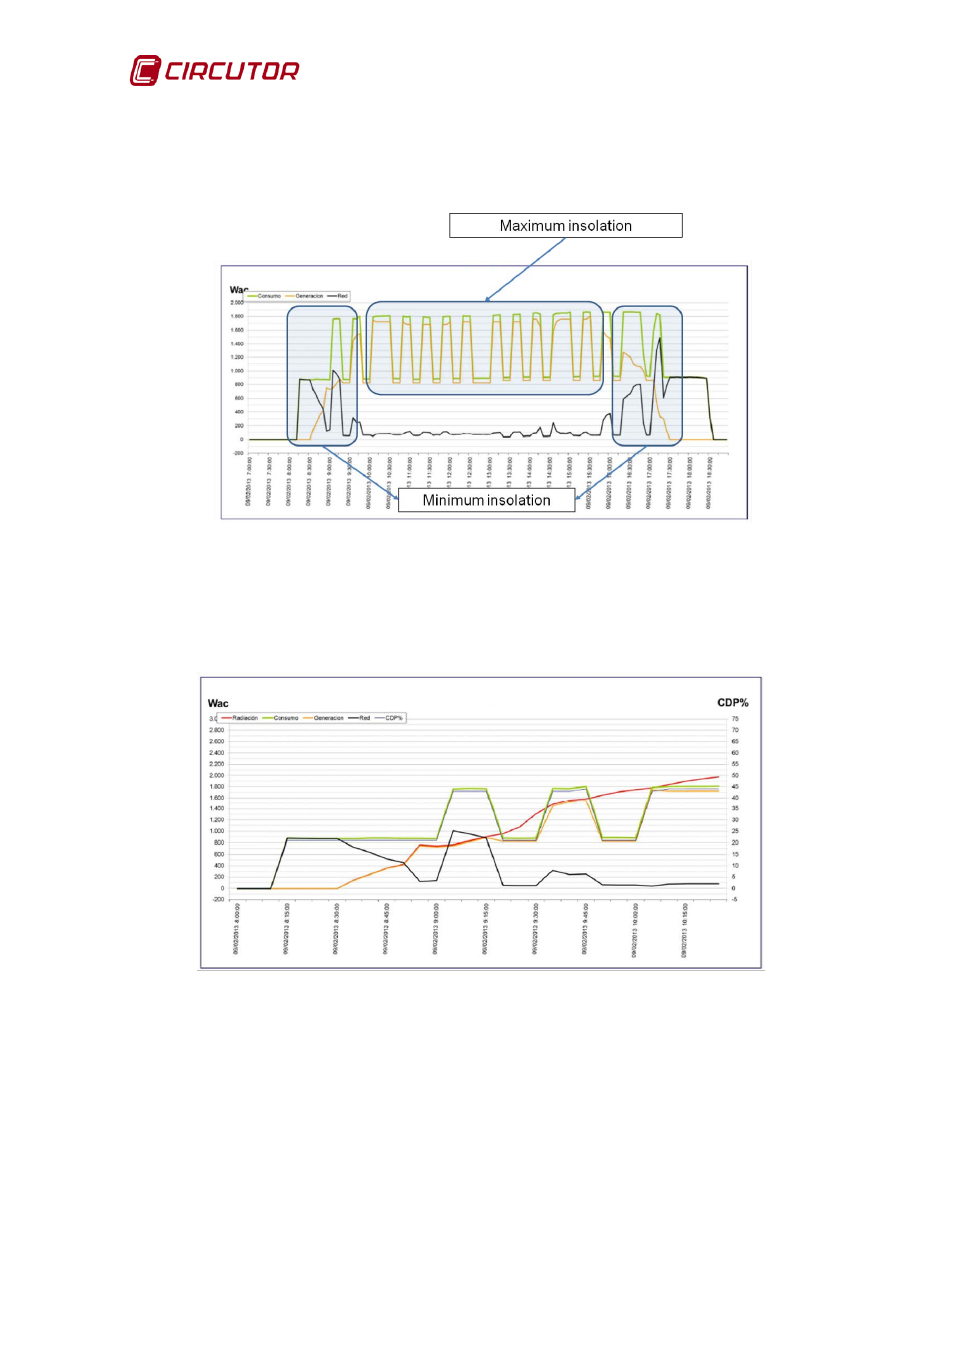
shows that during periods in which insolation is minimum, the user's
consumption is taken from the grid, however, it is the inverter that supplies
energy during periods with maximum insolation.
Figure 82: Graph showing the operation of the CDP based on insolation.
shows the above in more detail: as insolation increases (the red
curve), grid consumption (black line) decreases and the energy generated by the
inverter increases.
Figure 83: Detail of the CDP operation.
When the CDP is configured to work in three-phase mode and there is a
problem with the external CVM Minis or these have not been connected, dashes
appear in the corresponding power indication on the web site.
Advertising
This manual is related to the following products: