Ivie ie-33 & ie-35 manual, Strip chart recorder – Ivie IE-35 RTA - Real Time Analysis User Manual
Page 33
Ivie IE-33 & IE-35 Manual
page
33
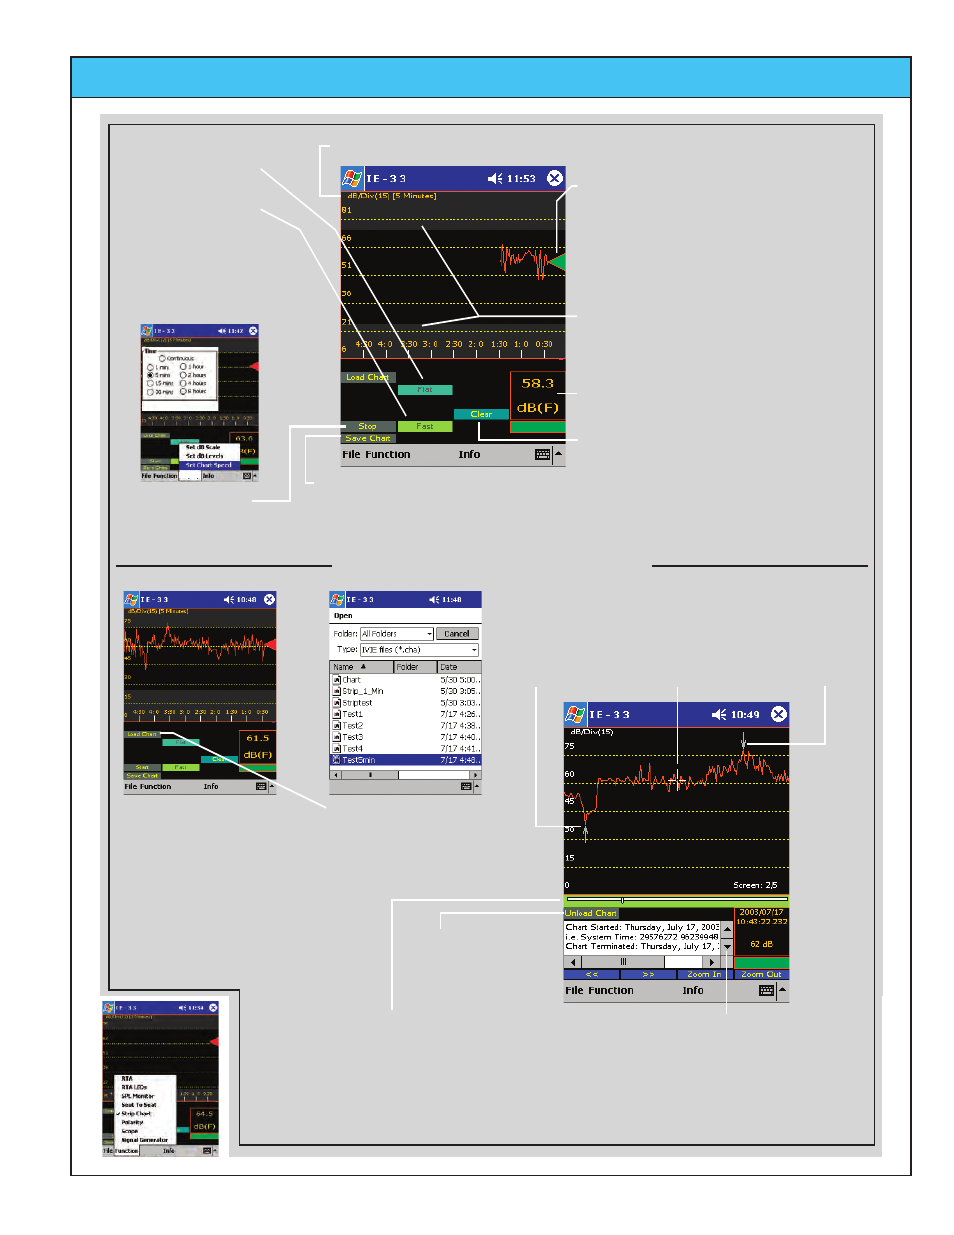
Recording Pen - Green in color when
the pen is down and writing/recording.
Red in color when pen is lifted and not
writing. Note: the pen is always
responding to the SPL even when not
writing.
Darkened areas are visual Min/Max
indicators set in the"Options/Set dB
Levels" menu.
Step 1 - Select SPL
Weighting.
Step 2 - Select SPL
detector response.
Step 3 - Select Recording
time by tapping Options,
Chart Speed, and then the
recording time.
Step 4 - Press the
"Start/Stop" button.
Current SPL and Weighting.
Clears the current Recording
and resets time to zero.
Save Chart - stops the current Recording and saves
data to a File. Brings up a "File Save" screen.
Completed 5 minute
Recording. Upon
completion, a Save to
File screen is
automatically
displayed.
To view a Saved Chart
press the "Load Chart"
button to display the
above screen, then
select the desired
Chart.
Cursor controlled
by the Joystick or
by tapping on the
screen with the
stylus.
Data at
Cursor.
Press to unload file
and return to
recording screen.
Scroll through data including:
File name, Test date/time, Total
number of data points, Sample
interval, Weighting, Max SPL &
time, Min SPL & time.
The Chart is displayed in an
expanded form so that each data
point is represented by one pixel.
The slide is used to "Page" through
the data one screen at a time.
Maximum
data point.
Minimum
data point.
Viewing a Previously Recorded File
dB per Division and Recording time
Options
Options
Options
Options
Options
Strip Chart Recorder