Sii calculation in insertion gain, Cros fitting using insertion gain, Rear measurement procedure – Audioscan Axiom User Manual
Page 74
Axiom
®
User's Guide Version 1.8
May 2015
4. Click on the REUR button (below REAR/REIG test 3).
5. Click on
to accept the default 55 dB SPL Pink noise stimulus and capture the REUR curve OR click on
the [Stimulus] and/or [Level] buttons to select other values. These choices have no impact on the resulting
REIG.
6. If there is a notch in the 4000 to 8000 Hz region, try advancing the probe tube 2 mm and repeating step 3. If
the notch moves to a higher frequency, repeat this step until the notch moves beyond the highest frequency
of interest.
Because it is analyzed in 1/3 octave bands, the Pink noise stimulus produces a REUR 12 dB below that produced
by the Swept stimulus at the same overall level.
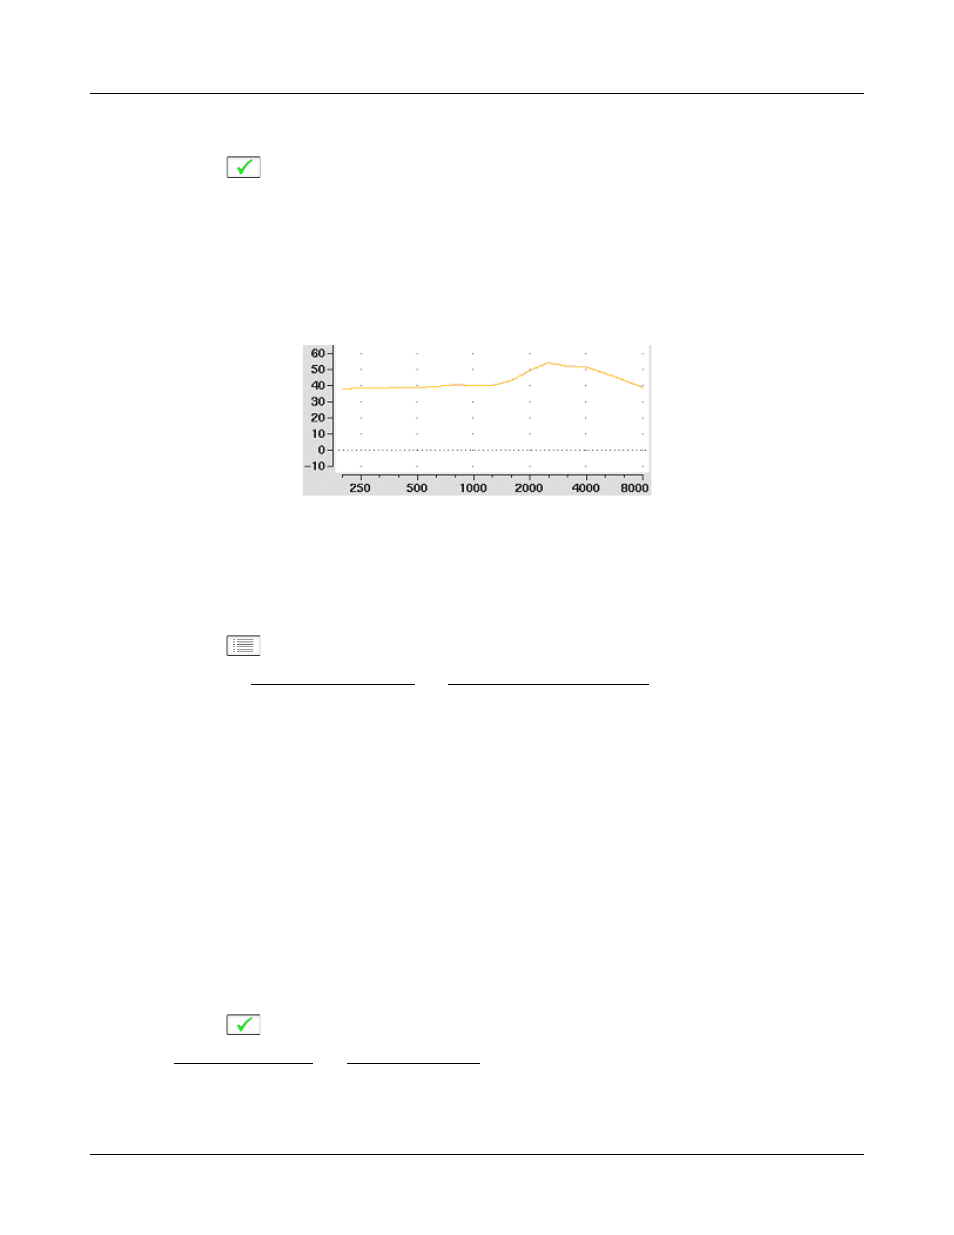
The Average REUR used is shown above. Measured REUR will vary from this.
For small children the peak may shift to the right and become sharper. Drainage tubes and perforated ear drums
will cause large differences - usually around 1 kHz.
REAR measurement procedure
1. Click on
and then click on [Insertion gain] in the On-ear menu
2. Referring to On-Ear Measures - Setup and On-Ear Measures Screen Setup, prepare the system, position the
patient and insert the probe tube. (For tight-fitting hearing aids or earmolds, the probe tube may be inserted
through a vent.)
3. Without disturbing the probe tube, insert the hearing instrument or earmold.
4. Referring to Audiometric data entry, enter threshold data.
5. Click on button 1, 2, or 3 in the REAR/REIG column. This will present a signal from the sound-field speaker
and display the REAR Setup box.
6. Click on the [Stimulus] button, then select either [Pink noise] or [Swept]. Use pink noise when using the
NAL-NL1 fitting formula. Use Swept when testing maximum output capabilities.
7. Click on the [Level] button, then select a stimulus level from the list box. Use the level shown on the target
REIG curves (if present). If no level is shown, use the lowest level required to overcome background noise.
8. Adjust the hearing instrument so that the REIG curve (SPL scale) or Aided threshold curve (HL scale)
approximates the dotted target curve. For multi-level targets, match each curve using the stimulus level
indicated.
9. Click on
to complete the test and capture the data.
See Insertion gain in SPL and Insertion gain in HL for an explanation of screen curves. See SII calculation in
Insertion gain
NOTE: Because it is analyzed in 1/3 octave bands, the Noise stimulus produces a REAR up to 12 dB below that
74