K-Patents PR-03 User Manual
Page 39
39
39
39
39
5 Startup, configuration and calibration adjustment
33
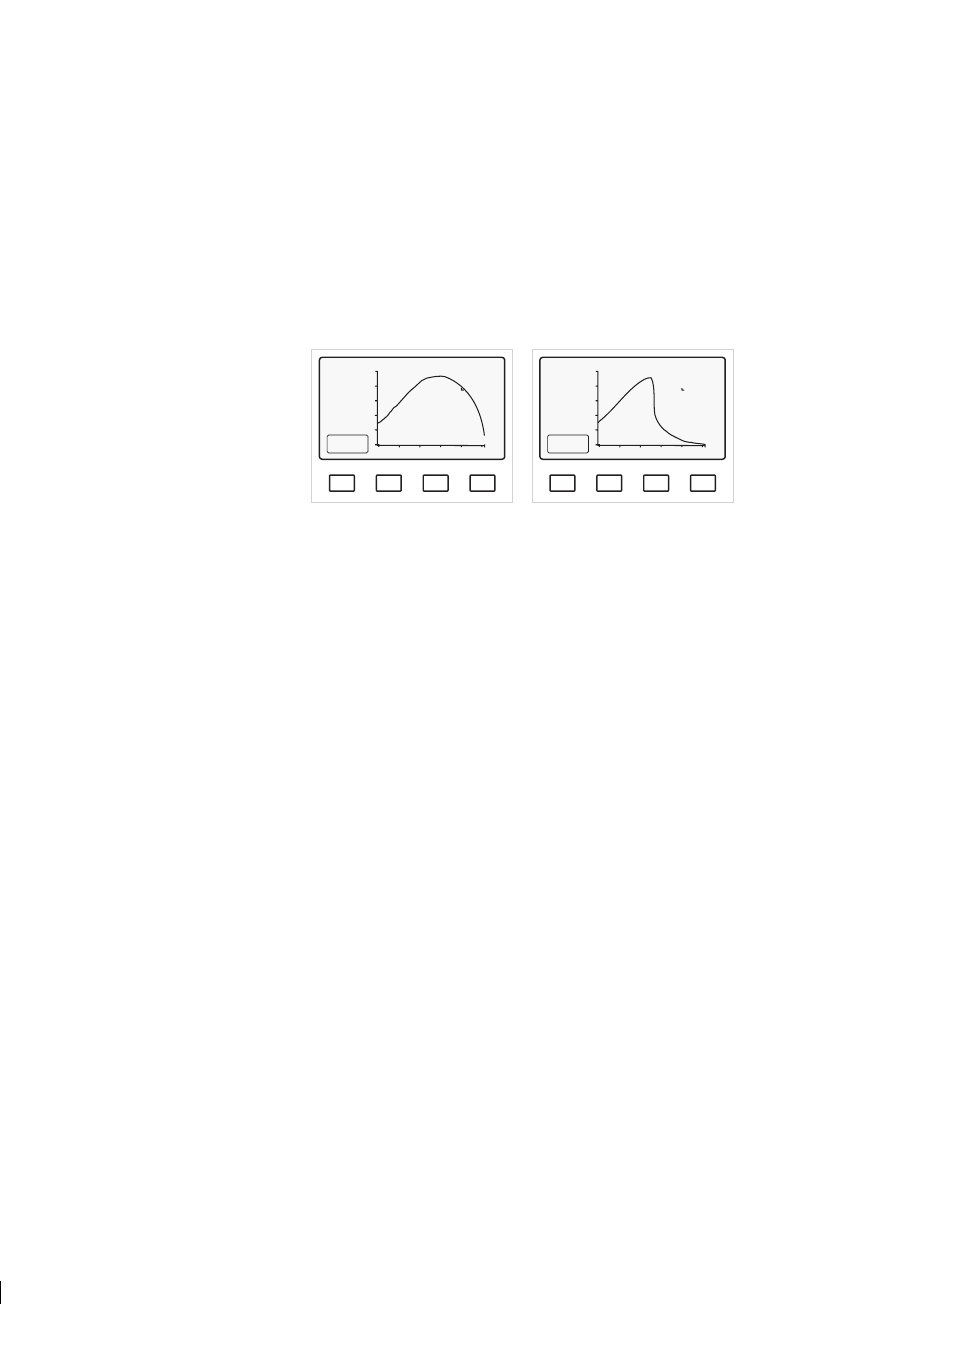
5.4.1 Viewing the Optical image
You can view the Optical image (Figure 5.6) by pressing the soft key Optical image (key A) in the
Information display
. The light area (high pulses) is to the left, the dark area (low pulses) is to the right,
compare to Figure 2.2. The vertical scale is 0–100 % of highest pulse amplitude, the horizontal scale
expresses the numbers of the photocells 0–1024.
Figures 5.6 below show some typical optical images appearing at startup.
A
B
C
D
Slope
TEST: 248.0
30.2 ºC
Endp: 11
L): 30.5
R(: 5.3
HT: 20 ºC
HH: 4
%
SCALED
OPTICAL
IMAGE
Low concentration / No sample
A
B
C
D
Slope
TEST: 133.6
30.2 ºC
Endp: 11
L): 16.5
R(: 30.3
HT: 20 ºC
HH: 4
%
SCALED
OPTICAL
IMAGE
Normal operation
Empty pipe
Normal conditions
Figure 5.6
Typical optical images
Press the RESET key to return to the Information display from the Optical image display.
5.4.2 Viewing System configuration
You can view the System configuration, i.e. information about your refractometer system settings, by press-
ing the soft key C (= System configuration) in the Information display. The System configuration
display contains:
− Main program and sensor processor and sensor interface processor versions
− Connection and processor versions of accessory units
− Current output scale: E.g. 4–20 mA = 40.0–60.0 CONC%
− Three soft keys:
− Relay configuration (key A); for details see Section 5.7, “Configuring relays”.
− Switch configuration (key B); for details see Section 5.6, “Configuring input switches”.
− Wash times (key C); for details see Section 5.9, “Configuring automatic prism wash”.
Press the RESET key to return to the Information display from the System configuration display.
5.4.3 Checking conditions inside sensor head
By pressing the soft key D (= Sensor
head
) in the Information display you will find out what the
conditions are inside the sensor head:
− Head temperature
− Head humidity
This is very useful information when suspecting a problem in the sensor head, for details see Section 7.2.2.