Online power – OnLine Power Protector 3 User Manual
Page 55
OnLine Power
6-16
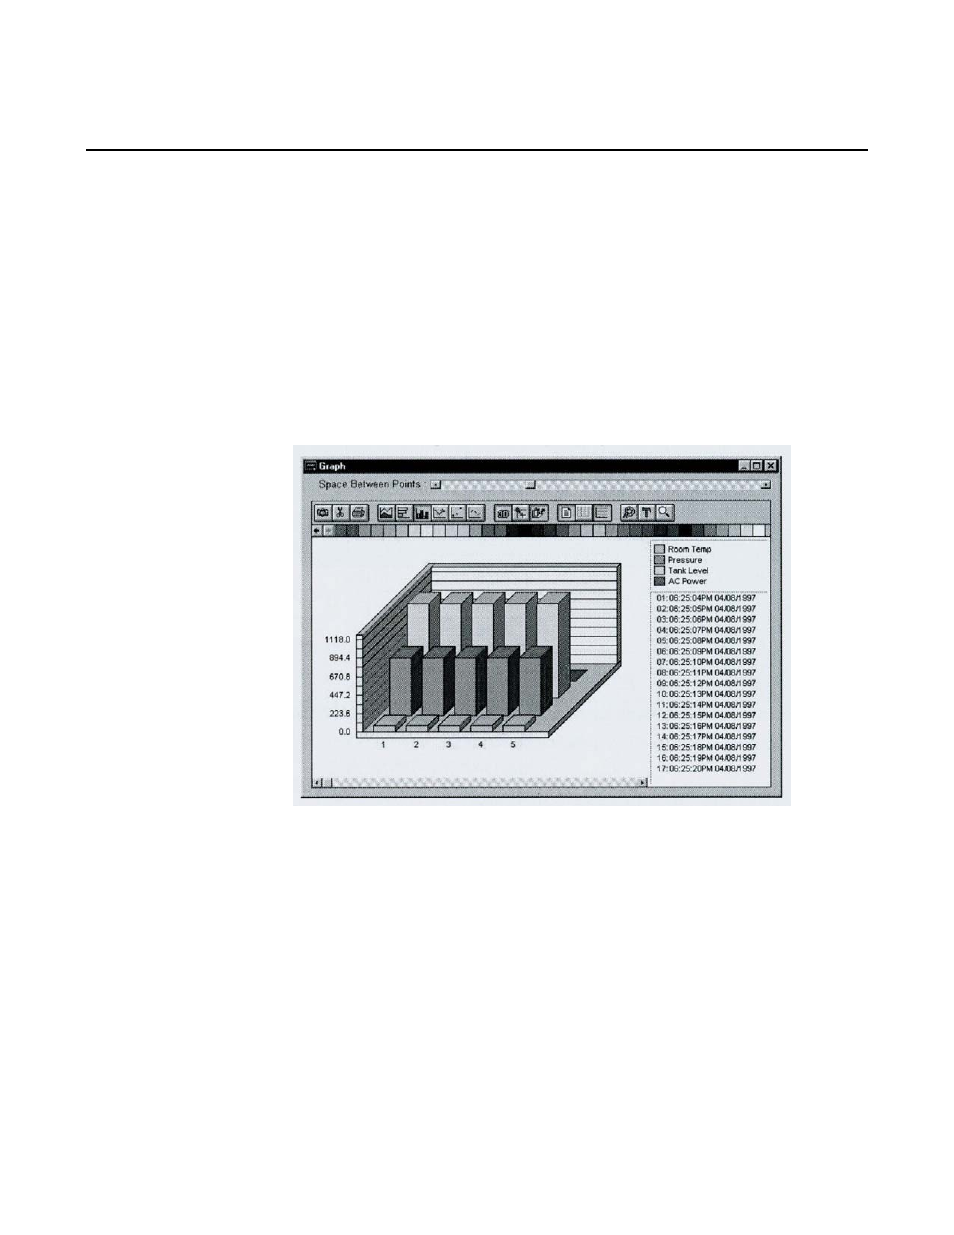
6.18.5.4 GRAPH:
Once the Data Log records have been displayed, they may be viewed in graph form by clicking
the "Graph" button. The graph will show all inputs selected in the query. If too many samples
are selected for graphing, the software gives you the option to average values. Oherwise, you will
have to perform a smaller query to avoid averaging. The graph has many features that allow to
display the data graphically, including line graphs, bar charts and three dimensional views.
Experimentation is the best way to larn about all of the available options. A sample graph follows.
PRINT:
Once the Data Log records have been display, they may be printed by clicking this button.
EXPORT:
Once the Data Log records have been displayed, the displayed information may be saved as a
comma-delimited file. This file can then be used in a spreadsheet such programs as Lotus 123 or
Microsoft Excel.
Send Report:
GMS 2000 can be programmed to automatically send reports to selected destinations. Check this
box to include this destination when sending reports.
Sample Graph