This screen shows – RJS Inspector D4000 SP (FIRMWARE version A.06 and Later) User Manual
Page 33
Operator
’s Guide
Inspector D4000
™ Laser SP
002-5572
RJS, Minneapolis, MN
25
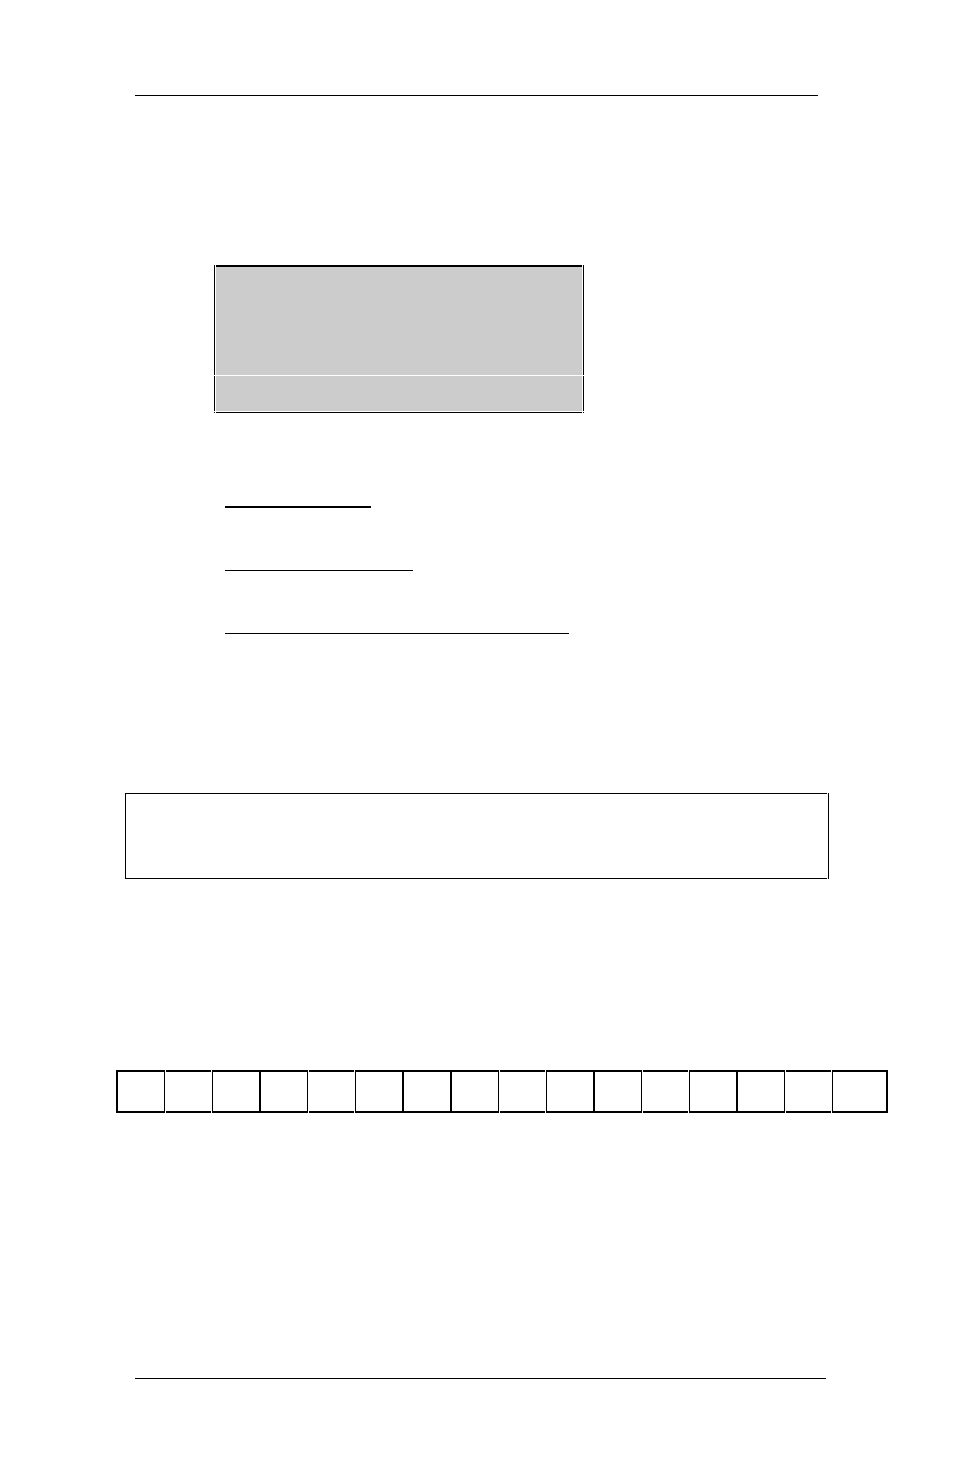
8.4 Inspection Results
Press Select to bring up the next screen:
Ratio: 2.2 P
D/bility .48 C
-100% Tol. +100%
--------RRARR+++
This screen shows:
The first line is the Ratio calculation (when appli-
cable)
The second line is the ISO/ANSI Decodability
percentage and letter grade
The third line and fourth lines are the Bar width
deviations chart
“R” letters represent “range”
of bar widths in the code.
“A” repre
sents the average of all character bar width
deviations.
Note:
The location of the
“A” is indicated with the 5 LEDs also
See Table 8-A.
The closer the
“A” is to the center of the display, the
better.
The following shows the percentage of the scanning
tolerance used at each position on the display:
-
93
-
79
-
65
-
50
-
36
-
22
-
8
-
1
0
+
8
+
22
+
36
+
50
+
65
+
79
+
93
Negative numbers to the left indicate bars that are
narrower
Positive numbers to the right indicate bars that are
wider
The closer the
“A” is to the edge, the more likely the
Reject.