Airmar WeatherCaster™ Software User Manual
Page 24
24
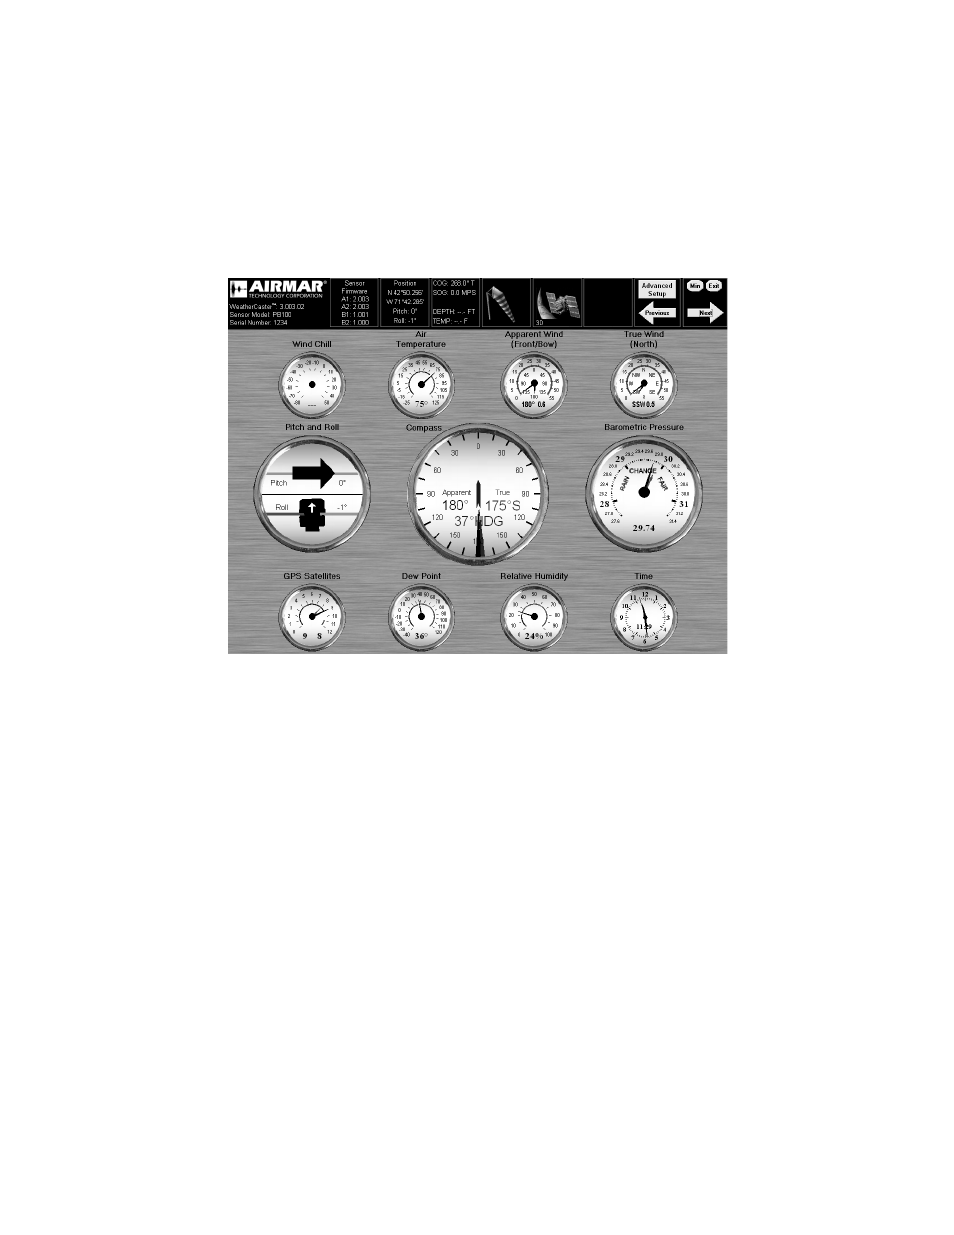
Analog Gauge Screen
Gauges display the data being sent from the sensor(s) (see Figure 25). Each gauge
displays data in both analog and digital formats.
High and Low Readings
Some gauges display a colored arc. A blue arc shows the lowest reading within a
24 hour period. A red arc show the highest reading within a 24 hour period. White
space between a blue and a red arc shows the range of the readings within a 24
hour period. Blue and red arcs may appear on all gauges except the Pitch and
Roll gauge, the Compass, the Barometric Pressure gauge, and the Time clock.
Displaying Historical Data
You can view historical data for each gauge except the Pitch and Roll gauge, the
Compass, and the Time clock. When you right click on a gauge, a graph will
appear. The graph displays the unit of measure on the left and time at the bottom.
A red line will indicate the history.
Figure 25. Analog Gauge Screen