Barometric pressure, Gps satellite gauge, Dewpoint gauge – Airmar WeatherCaster™ Software User Manual
Page 27
27
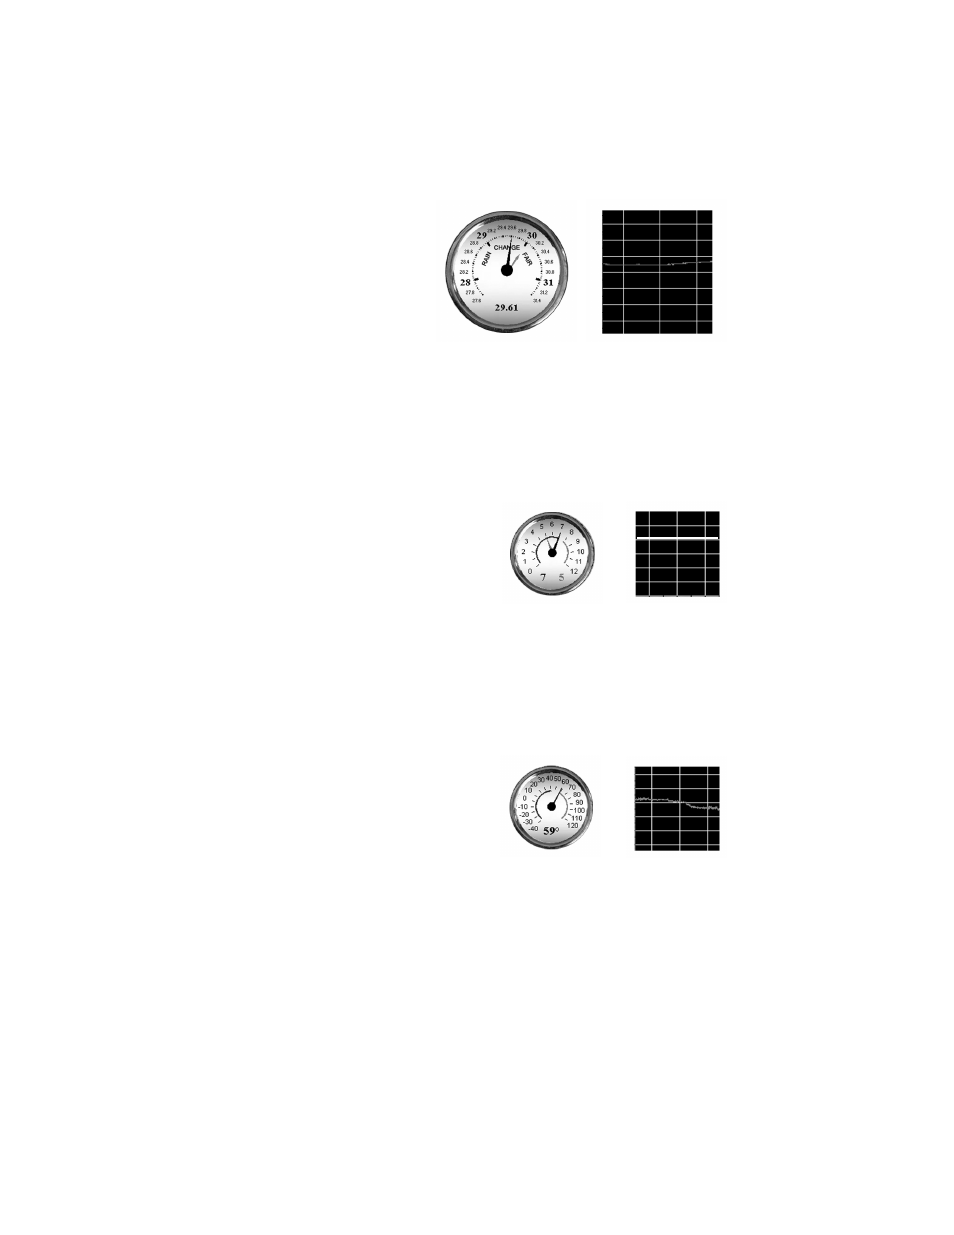
Barometric Pressure
This gauge uses a black/white
needle to indicate the current
barometric pressure. A red
needle is the reference marker.
By aligning the red needle with
the black/white needle, it is
possible to see changes in
barometric pressure over time.
A digital readout of the current
barometric pressure is found at the bottom of the gauge.
Left click and hold the mouse over the red reference needle to align it with the
black/white needle. To view historical barometric readings, right click the gauge. A
graph will appear as shown. The red line indicates the barometric pressure over a
period of time. The green dot indicates when the reference needle was set. To
return to the Barometric Pressure gauge, right click the graph.
GPS Satellite Gauge
This gauge uses a long needle to indicate
the number of satellites in view. The short
needle indicates how many satellites are
being used in the calculation to determine
current position. There is also a digital
readout at the bottom. The numeral on the
left indicates the number of satellites in
view. The numeral on the right indicates
the number of satellites used to calculate a fix.
NOTE: Four or more satellites are required for a 3-D fix.
To view historical GPS data, right click the gauge. A graph will appear as shown.
To return to the GPS Satellite gauge, right click the graph.
Dewpoint Gauge
This gauge uses a needle to indicate the
dewpoint temperature. There is also a
digital readout at the bottom.
To view historical dew point data, right
click the gauge. A graph will appear as
shown. To return to the Dewpoint gauge,
right click the graph.
9:00AM 12:00PM
Barometric Pressure
30
29.5
29
28.5
28
27.5
30.5
31
31.5
GPS Satellites
9:00AM 12:00PM
6
5
4
3
2
1
0
9:00AM 12:00PM
Dewpoint
80
70
60
50
100
90