H3C Technologies H3C Intelligent Management Center User Manual
Page 107

98
1.
Click the Report tab.
2.
From the navigation tree, select Reports > Report Template List.
3.
In the Query Template area, select Voice Service Report from the Type list.
4.
Click Query to display all voice service report templates in the Report Template List.
5.
Click the All Calls Report link to specify a time range for the statistics in the report:
{
Report data begin time—Specify the start time of the query range.
{
Report data end time—Specify the end time of the query range.
6.
Click OK.
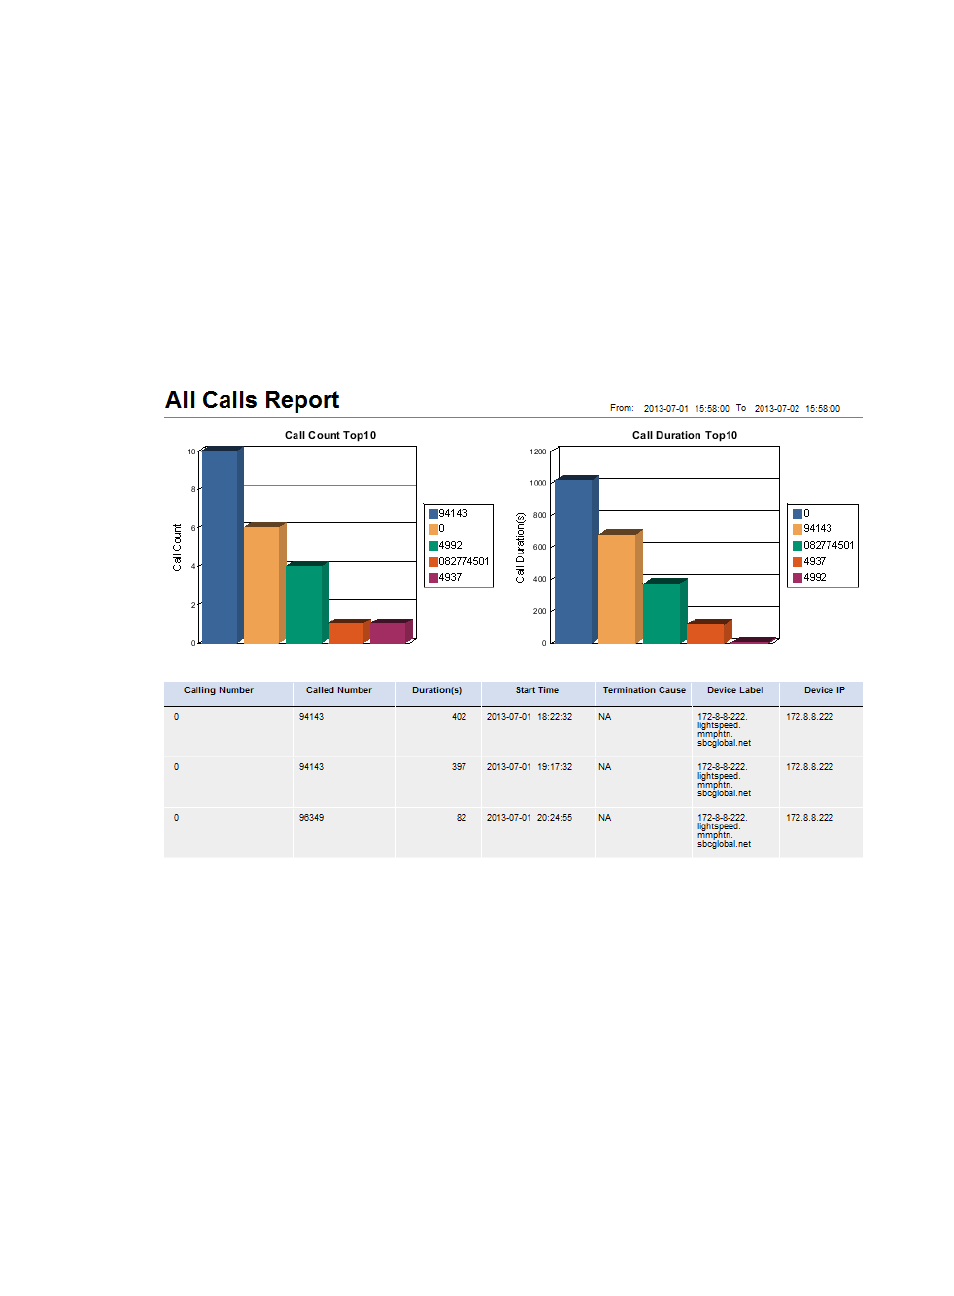
shows an example of the top 10 numbers report.
Figure 17 All Calls Report
The following lists the fields on the report that require an explanation:
•
Call Count Top10—This bar chart shows the top 10 numbers by call count. Each bar represents a
phone number with the number of calls. The horizontal axis indicates the phone numbers with
different colors, and the vertical axis indicates the number of calls.
•
Call Duration Top10—This bar chart shows the top 10 numbers with the longest call duration and
the total call duration for each phone number. The horizontal axis indicates the phone numbers with
different colors, and the vertical axis indicates the total call duration in seconds.
•
Calling Number—Phone number of the calling party.
•
Called Number—Phone number of the called party.
•
Duration(s)—Call duration in seconds.
•
Start Time—Time when the call started.
•
Termination Cause—Reason that the call was terminated.