Test result – top 5 high-quality tunnels, Test result summary – H3C Technologies H3C Intelligent Management Center User Manual
Page 93
Advertising
84
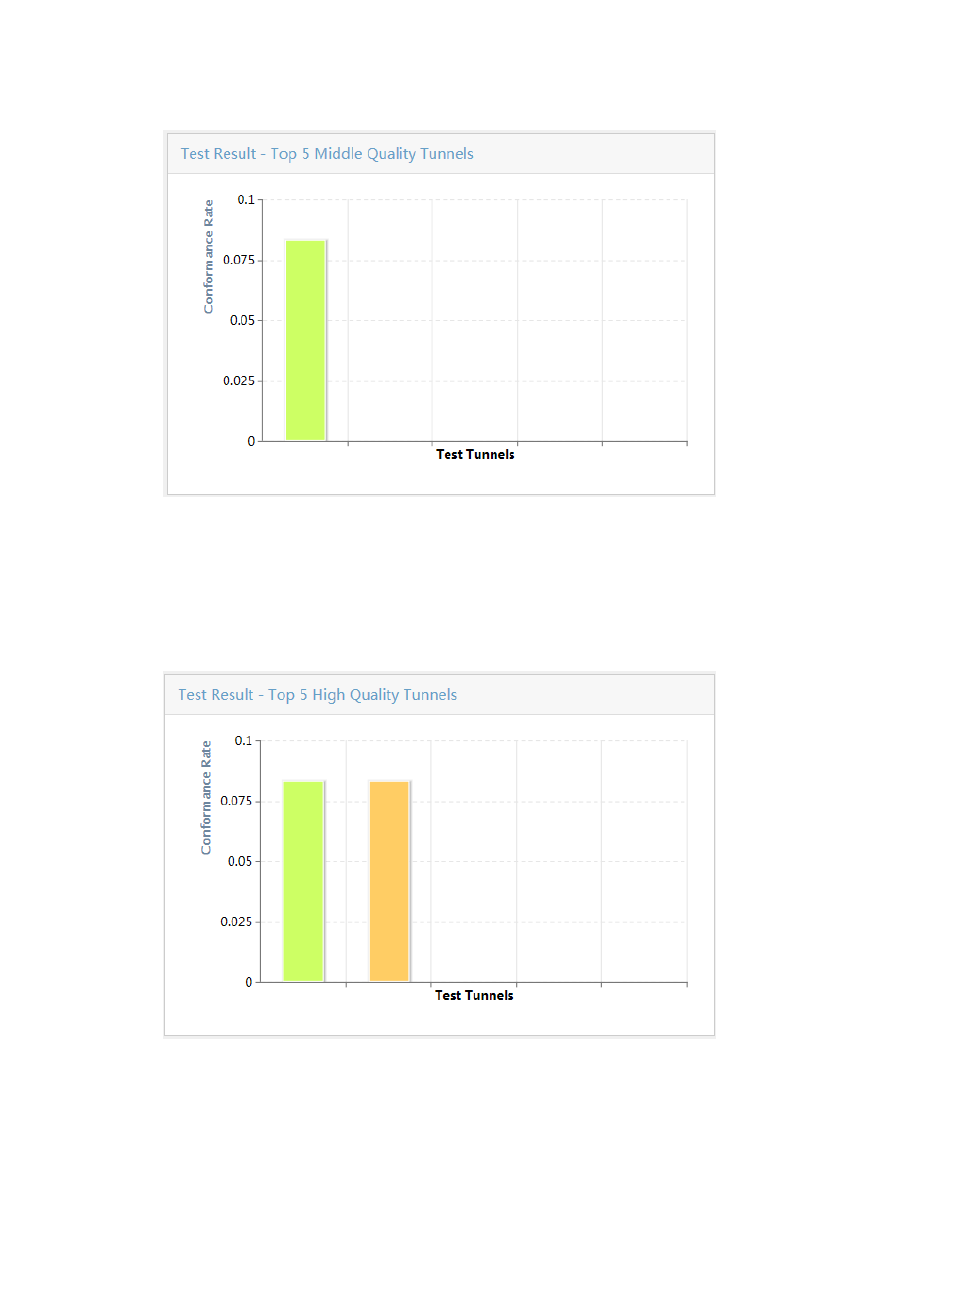
Figure 11 Top 5 middle-quality tunnels
Test result – top 5 high-quality tunnels
This bar chart shows the top 5 high-quality tunnels by conformance rate within the query time range
(Conformance rate = High Quality test results/Total tests).
For more information about the bar chart, see “
Test result – top 5 fault tunnels
Figure 12 Top 5 high-quality tunnels
Test result summary
This pie chart shows the number of test results for each result type within the query time range.
Each result type is identified by a color. You can click an area on the pie to view the line graph for the
test result type.
Advertising