Snmp details screen, Snmp details screen -37 – Verilink WANsuite 5330 (34-00302.F) Product Manual User Manual
Page 115
V T 1 0 0 I n t e r f a c e
4-37
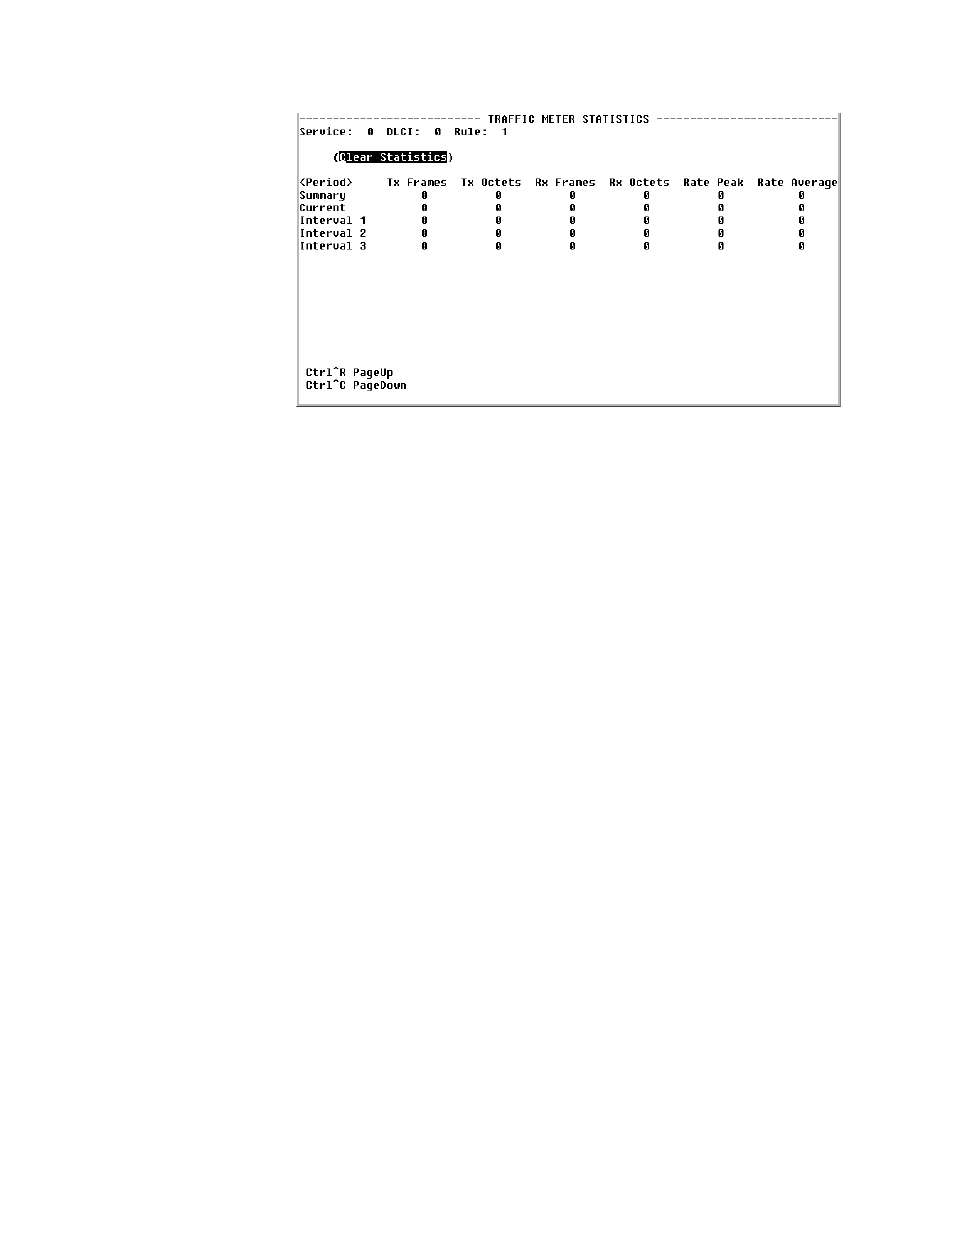
Figure 4.27
Traffic Meter Statistics Screen
The Traffic Meter Statistics screen reports on the following parameters:
•
Tx Frames
•
Tx Octets
•
Rx Frames
•
Rx Octets
•
Rate Peak – the peak data rate for the viewed period (see below)
•
Rate Average – the average data rate for the viewed period (see below)
The “Period” refers to the period of time for which the Traffic Meter statistics
are reported as listed below.
Summary
Represents the past 24 hours; reports the additive number of frames/octets, the
highest peak encountered for 24 hours, and the average for 24 hours.
Current
Reports on the current 15-minute interval.
Interval 1,
Interval 2,...,
Interval 96
Reports on Intervals 1-96, which correspond to the periods completed 15
minutes ago, 30 minutes ago,..., 24 hours ago.
SNMP Details Screen
The unit detects and reports network alarms and provides several options for
reporting them, one of which is SNMP traps. When a network alarm occurs,
the unit sends a trap message to as many as eight destinations on your
network. The unit will report each alarm by transmitting an SNMP “trap” to
each non-zero Trap IP address.
The SNMP Details screen (Figure 4.28) lets you configure the SNMP
parameters described in the paragraphs below.